SOM cluster: 45
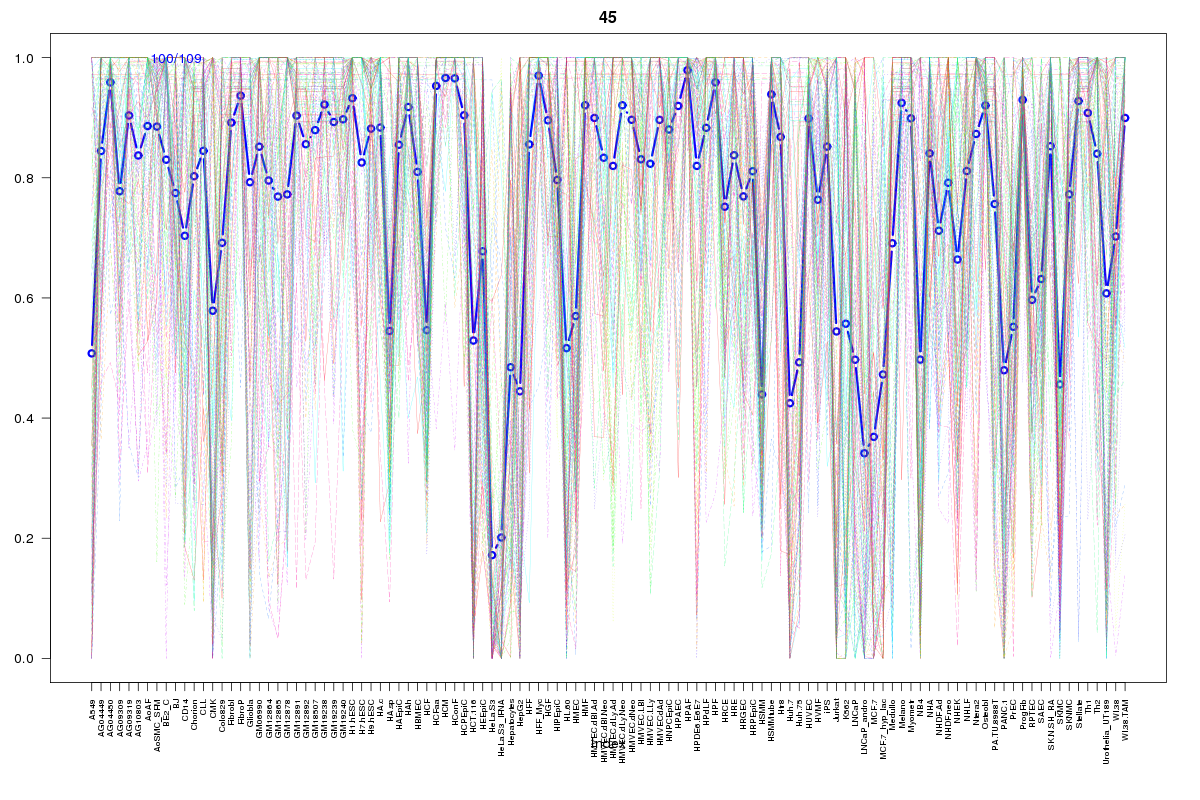
Cluster Hypersensitivity Profile

Genomic Location Trend
These plots show the distribution of the DHS sites surrounding the Transcript Start Site of the nearest gene.
Stats
Number of sites: 109Promoter: 63%
CpG-Island: 63%
Conserved: 67%
Enriched Motifs & Matches
Match Detail: [Jaspar]
|
| ||
|---|---|---|
| Sites: 88/100 | e-val: 0 | ||
| Factor | e-val(match) | DB |
| SP1 | 0.00000000000052425 | JASPAR |
| Klf4 | 0.0000028574 | JASPAR |
| INSM1 | 0.0003894 | JASPAR |
| Egr1 | 0.001331 | JASPAR |
| Pax4 | 0.0046126 | JASPAR |
|
| ||
| Sites: 9/100 | e-val: 0.000000000043 | ||
| Factor | e-val(match) | DB |
| AP1 | 0.00016294 | JASPAR |
| ELK4 | 0.00045704 | JASPAR |
| Spz1 | 0.0015251 | JASPAR |
| SPIB | 0.0026009 | JASPAR |
| GABPA | 0.005829 | JASPAR |
|
| ||
| Sites: 24/100 | e-val: 0.0000000000043 | ||
| Factor | e-val(match) | DB |
| NFYA | 0.00000047228 | JASPAR |
| PBX1 | 0.0038301 | JASPAR |
| Pdx1 | 0.0038754 | JASPAR |
| NFIC | 0.017086 | JASPAR |
| GATA3 | 0.023719 | JASPAR |
BED file downloads
Top 10 Example Regions
| Location | Gene Link | Dist. |
|---|---|---|
| chr6: 27858540-27858690 | HIST1H4L | 49.69 |
| chr6: 27858540-27858690 | HIST1H2BN | 49.69 |
| chr6: 27858540-27858690 | OR2W6P | 49.69 |
| chr6: 27858540-27858690 | HIST1H3I | 49.69 |
| chr19: 11909240-11909390 | ZNF439 | 50.96 |
| chr2: 31456820-31456970 | EHD3 | 52.07 |
| chr2: 31456820-31456970 | CAPN14 | 52.07 |
| chr3: 134513980-134514130 | EPHB1 | 58.09 |
| chr1: 95392600-95392750 | RP4-639F20.1 | 60.61 |
| chr1: 95392600-95392750 | CNN3 | 60.61 |