SOM cluster: 448
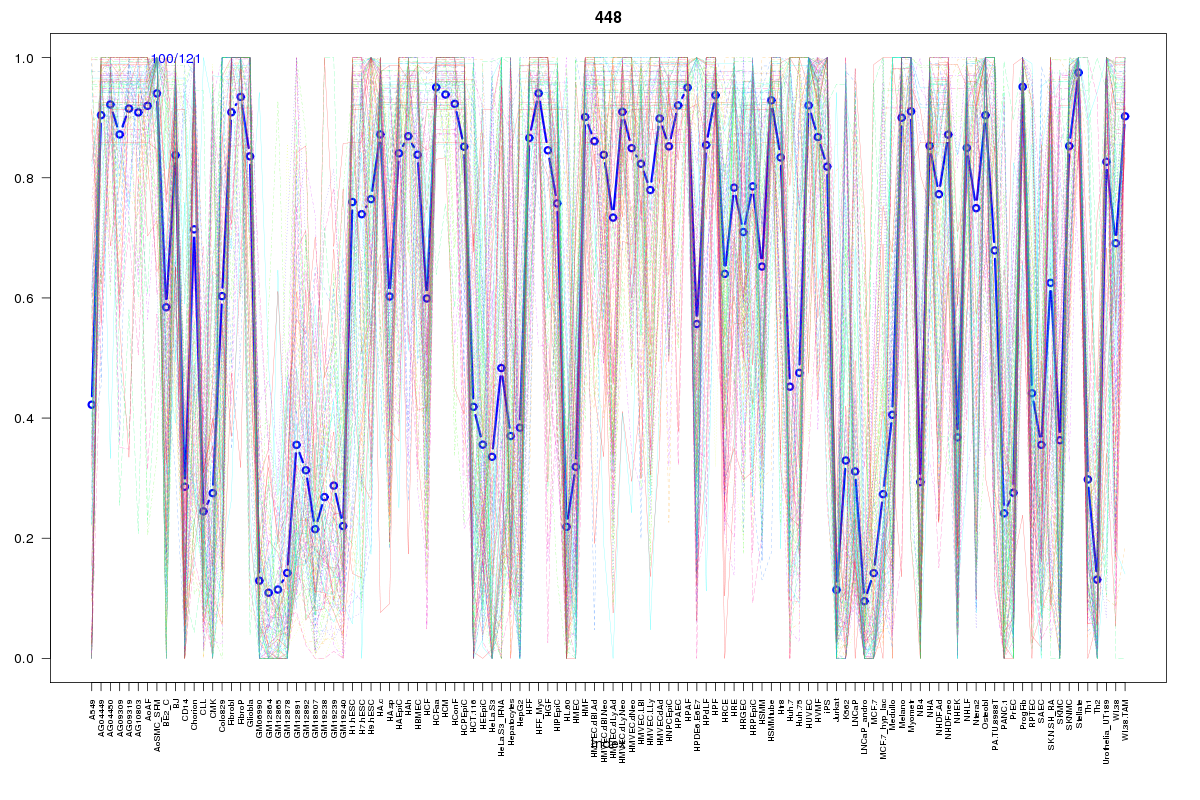
Cluster Hypersensitivity Profile

Genomic Location Trend
These plots show the distribution of the DHS sites surrounding the Transcript Start Site of the nearest gene.
Stats
Number of sites: 121Promoter: 27%
CpG-Island: 28%
Conserved: 83%
Enriched Motifs & Matches
Match Detail: [Jaspar]
|
| ||
|---|---|---|
| Sites: 93/100 | e-val: 0 | ||
| Factor | e-val(match) | DB |
| Pax4 | 0.000000010212 | JASPAR |
| SP1 | 0.0000005091 | JASPAR |
| RREB1 | 0.000025516 | JASPAR |
| PLAG1 | 0.0017189 | JASPAR |
| Tal1::Gata1 | 0.0020689 | JASPAR |
|
| ||
| Sites: 47/100 | e-val: 0.000000000000017 | ||
| Factor | e-val(match) | DB |
| Klf4 | 0.00025123 | JASPAR |
| RREB1 | 0.00027194 | JASPAR |
| SP1 | 0.00066759 | JASPAR |
| Myb | 0.0006839 | JASPAR |
| Egr1 | 0.00070373 | JASPAR |
|
| ||
| Sites: 56/100 | e-val: 0.0000092 | ||
| Factor | e-val(match) | DB |
| SP1 | 0.0000612 | JASPAR |
| PLAG1 | 0.0022198 | JASPAR |
| RXR::RAR_DR5 | 0.017241 | JASPAR |
| REST | 0.023362 | JASPAR |
| SPI1 | 0.032683 | JASPAR |
BED file downloads
Top 10 Example Regions
| Location | Gene Link | Dist. |
|---|---|---|
| chr3: 183894400-183894550 | AP2M1 | 39.44 |
| chr3: 183894400-183894550 | EIF2B5 | 39.44 |
| chr3: 183894400-183894550 | CAMK2N2 | 39.44 |
| chr3: 183894400-183894550 | ECE2 | 39.44 |
| chr3: 183894400-183894550 | DVL3 | 39.44 |
| chr1: 145092540-145092690 | PDE4DIP | 57.8 |
| chr1: 145092540-145092690 | SEC22B | 57.8 |
| chr19: 9957780-9957930 | PIN1 | 60.87 |
| chr19: 41829520-41829670 | TMEM91 | 64.12 |
| chr19: 41829520-41829670 | EXOSC5 | 64.12 |