SOM cluster: 447
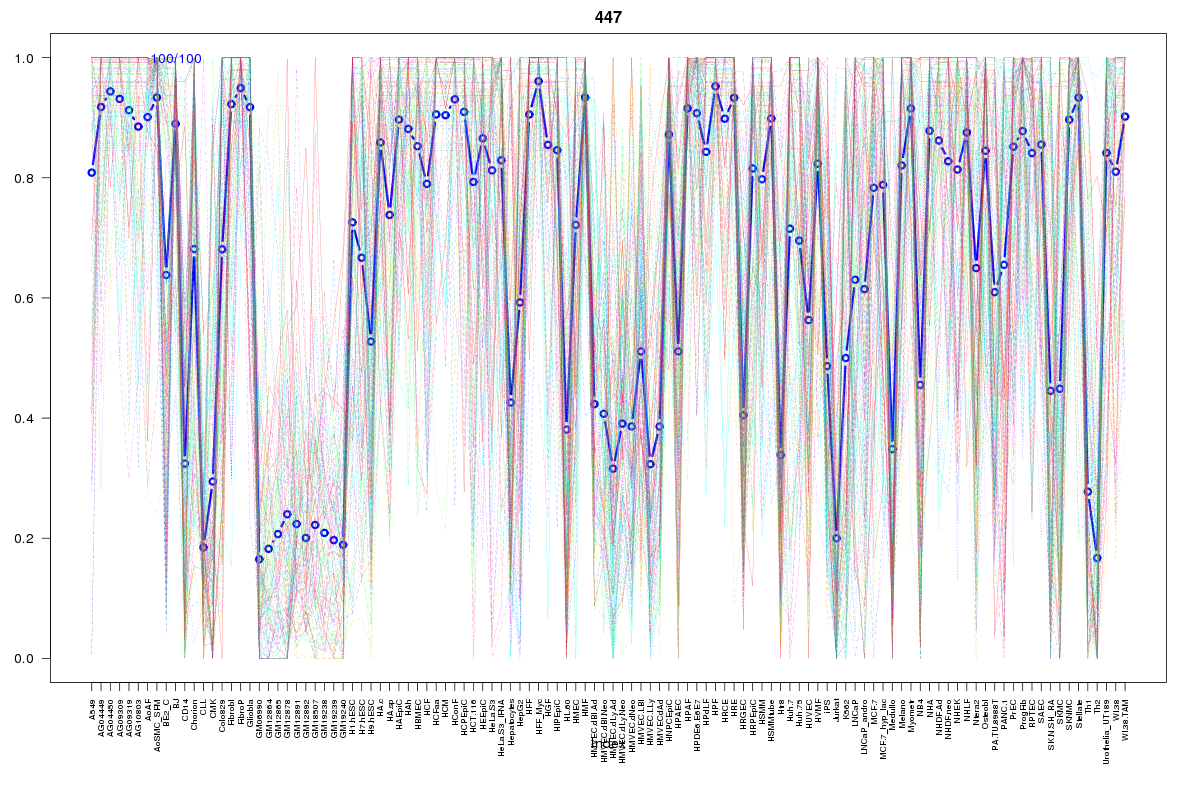
Cluster Hypersensitivity Profile

Genomic Location Trend
These plots show the distribution of the DHS sites surrounding the Transcript Start Site of the nearest gene.
Stats
Number of sites: 100Promoter: 18%
CpG-Island: 9%
Conserved: 68%
Enriched Motifs & Matches
Match Detail: [Jaspar]
|
| ||
|---|---|---|
| Sites: 43/100 | e-val: 3.7e-17 | ||
| Factor | e-val(match) | DB |
| SP1 | 0.000000011249 | JASPAR |
| Pax4 | 0.0000043291 | JASPAR |
| RREB1 | 0.0010228 | JASPAR |
| RXR::RAR_DR5 | 0.0019618 | JASPAR |
| PLAG1 | 0.0035772 | JASPAR |
|
| ||
| Sites: 38/100 | e-val: 0.0000000000056 | ||
| Factor | e-val(match) | DB |
| NFE2L2 | 0.00000000011557 | JASPAR |
| AP1 | 0.0000000057836 | JASPAR |
| PPARG | 0.0055156 | JASPAR |
| NFE2L1::MafG | 0.017635 | JASPAR |
| RORA_2 | 0.045882 | JASPAR |
BED file downloads
Top 10 Example Regions
| Location | Gene Link | Dist. |
|---|---|---|
| chr11: 57089840-57089990 | TNKS1BP1 | 45.65 |
| chr11: 57089840-57089990 | SSRP1 | 45.65 |
| chr11: 57089840-57089990 | APLNR | 45.65 |
| chr1: 204049620-204049770 | ETNK2 | 46.2 |
| chr1: 204049620-204049770 | LINC00303 | 46.2 |
| chr8: 38592380-38592530 | Y_RNA | 52.17 |
| chr6: 149067980-149068130 | UST | 61.19 |
| chr9: 132096520-132096670 | RP11-65J3.1 | 63.75 |
| chr19: 49071740-49071890 | NTN5 | 68.2 |
| chr22: 43084540-43084690 | CYB5R3 | 69.02 |