SOM cluster: 445
Cluster Hypersensitivity Profile

Genomic Location Trend
These plots show the distribution of the DHS sites surrounding the Transcript Start Site of the nearest gene.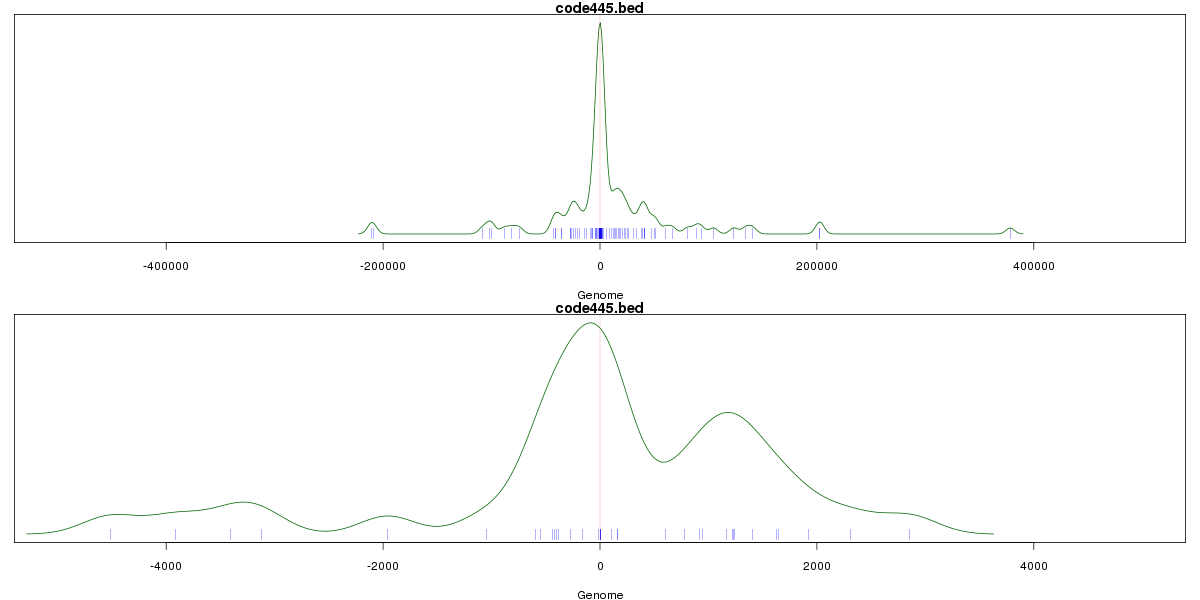
Stats
Number of sites: 133Promoter: 17%
CpG-Island: 2%
Conserved: 73%
Enriched Motifs & Matches
Match Detail: [Jaspar]
|
| ||
|---|---|---|
| Sites: 33/100 | e-val: 4.5e-22 | ||
| Factor | e-val(match) | DB |
| CTCF | 0.00000000000019507 | JASPAR |
| TAL1::TCF3 | 0.00062867 | JASPAR |
| T | 0.0067225 | JASPAR |
| INSM1 | 0.017873 | JASPAR |
| Zfp423 | 0.020641 | JASPAR |
|
| ||
| Sites: 23/100 | e-val: 0.0000000025 | ||
| Factor | e-val(match) | DB |
| Foxd3 | 0.00039328 | JASPAR |
| NFATC2 | 0.00094592 | JASPAR |
| Foxq1 | 0.0070214 | JASPAR |
| EWSR1-FLI1 | 0.011282 | JASPAR |
| Pax4 | 0.014247 | JASPAR |
BED file downloads
Top 10 Example Regions
| Location | Gene Link | Dist. |
|---|---|---|
| chr10: 24931980-24932130 | ARHGAP21 | 38.23 |
| chr10: 24931980-24932130 | RNA5SP305 | 38.23 |
| chr5: 64779660-64779810 | ADAMTS6 | 48.13 |
| chr1: 161762600-161762750 | ATF6 | 49.75 |
| chr3: 151987360-151987510 | MBNL1-AS1 | 56.76 |
| chr6: 30495860-30496010 | HLA-E | 59.47 |
| chr3: 15839380-15839530 | ANKRD28 | 60.03 |
| chr6: 134962100-134962250 | CTA-31J9.2 | 60.93 |
| chr6: 134962100-134962250 | FAM8A6P | 60.93 |
| chrX: 13506340-13506490 | RP11-1L9.1 | 61.15 |