SOM cluster: 444
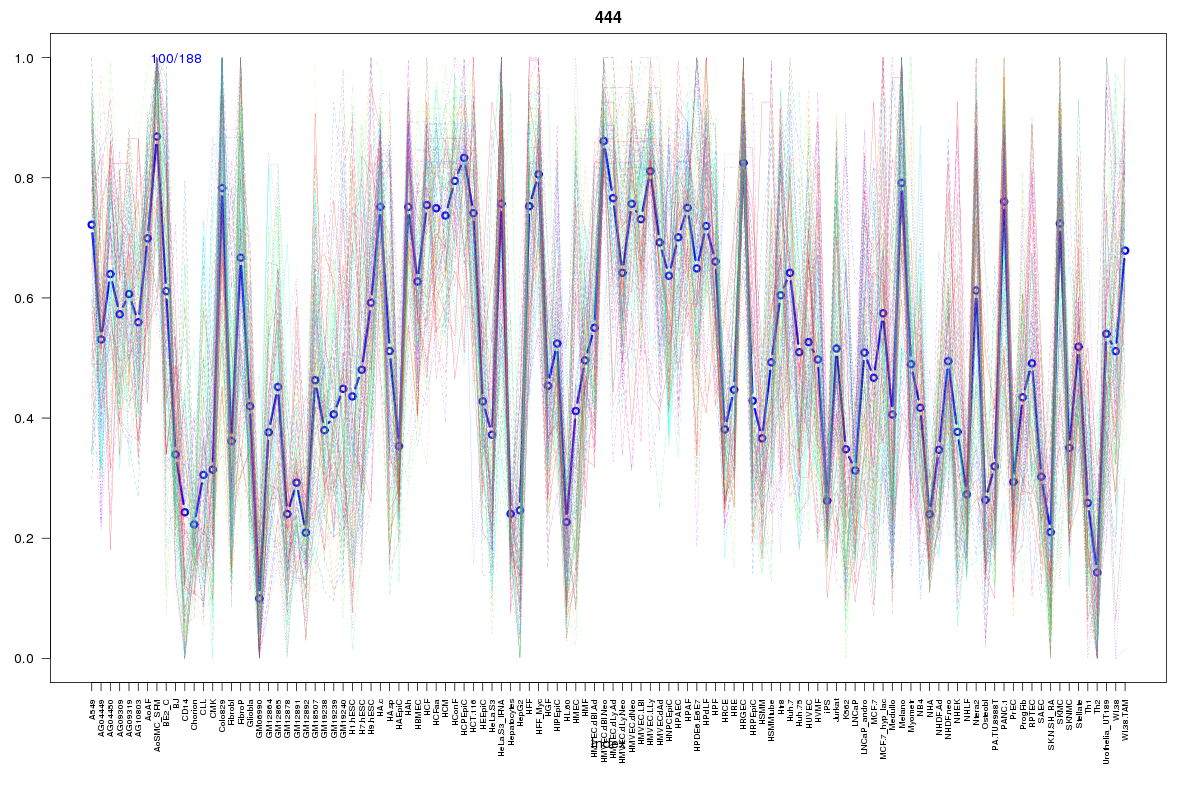
Cluster Hypersensitivity Profile

Genomic Location Trend
These plots show the distribution of the DHS sites surrounding the Transcript Start Site of the nearest gene.
Stats
Number of sites: 188Promoter: 1%
CpG-Island: 0%
Conserved: 91%
Enriched Motifs & Matches
Match Detail: [Jaspar]
|
| ||
|---|---|---|
| Sites: 83/100 | e-val: 0 | ||
| Factor | e-val(match) | DB |
| CTCF | 0.0000000000010921 | JASPAR |
| INSM1 | 0.0023508 | JASPAR |
| Zfp423 | 0.0072477 | JASPAR |
| T | 0.014695 | JASPAR |
| TAL1::TCF3 | 0.025117 | JASPAR |
BED file downloads
Top 10 Example Regions
| Location | Gene Link | Dist. |
|---|---|---|
| chr11: 86581120-86581270 | PRSS23 | 47.61 |
| chr11: 86581120-86581270 | FZD4 | 47.61 |
| chr11: 86581120-86581270 | RP11-736K20.5 | 47.61 |
| chr7: 83565500-83565650 | SEMA3A | 56.41 |
| chr7: 47219920-47220070 | TNS3 | 58.8 |
| chrX: 114925020-114925170 | PLS3 | 63.63 |
| chrX: 114925020-114925170 | AC005000.1 | 63.63 |
| chr4: 159651220-159651370 | PPID | 65.3 |
| chr21: 30536760-30536910 | CCT8 | 65.74 |
| chr5: 17190680-17190830 | BASP1 | 68.69 |