SOM cluster: 44
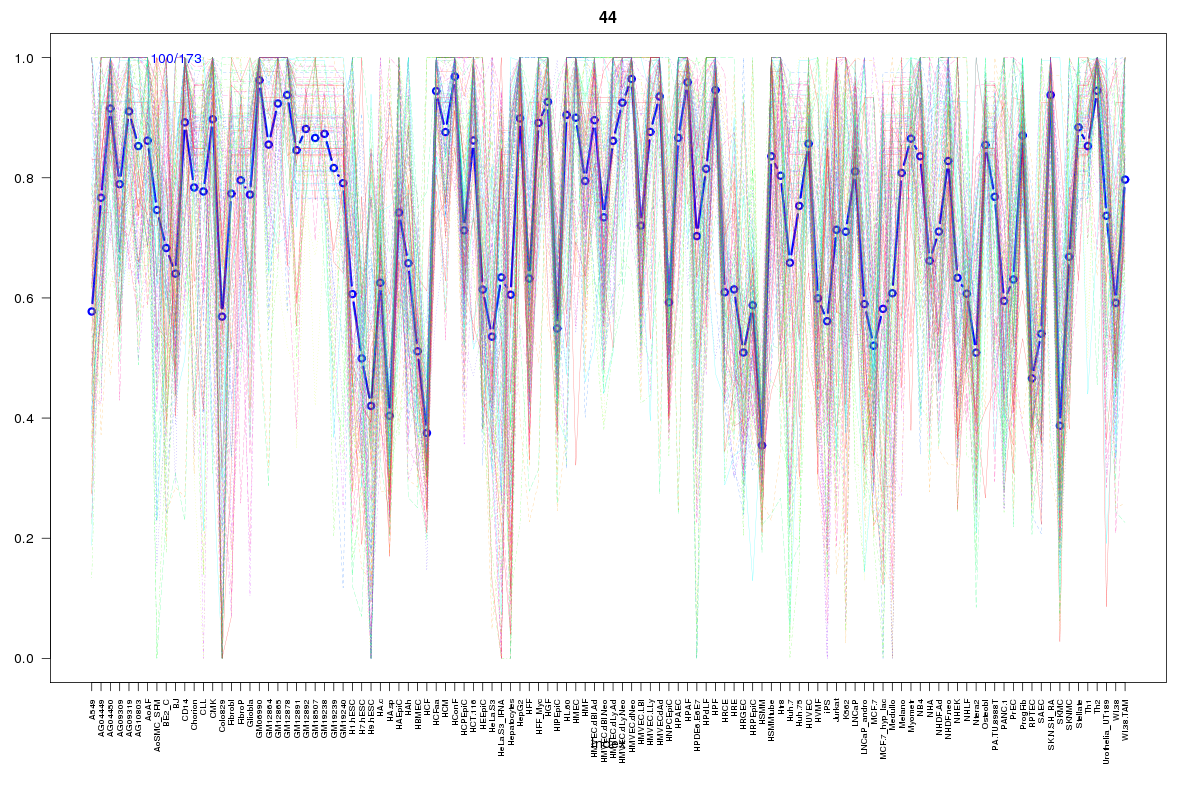
Cluster Hypersensitivity Profile

Genomic Location Trend
These plots show the distribution of the DHS sites surrounding the Transcript Start Site of the nearest gene.
Stats
Number of sites: 173Promoter: 63%
CpG-Island: 89%
Conserved: 81%
Enriched Motifs & Matches
Match Detail: [Jaspar]
|
| ||
|---|---|---|
| Sites: 95/100 | e-val: 0 | ||
| Factor | e-val(match) | DB |
| SP1 | 0.000000030957 | JASPAR |
| Klf4 | 0.0001477 | JASPAR |
| TFAP2A | 0.00033928 | JASPAR |
| Egr1 | 0.0039147 | JASPAR |
| PLAG1 | 0.011849 | JASPAR |
|
| ||
| Sites: 72/100 | e-val: 5e-26 | ||
| Factor | e-val(match) | DB |
| SP1 | 0.00019416 | JASPAR |
| TFAP2A | 0.0012163 | JASPAR |
| Klf4 | 0.025668 | JASPAR |
| PLAG1 | 0.031335 | JASPAR |
| INSM1 | 0.085274 | JASPAR |
BED file downloads
Top 10 Example Regions
| Location | Gene Link | Dist. |
|---|---|---|
| chr10: 30722940-30723090 | MAP3K8 | 27.81 |
| chrX: 48334505-48334655 | TBC1D25 | 45.74 |
| chr17: 1552780-1552930 | SERPINF2 | 51.9 |
| chr12: 49504405-49504555 | TUBA1A | 58.97 |
| chr19: 2016040-2016190 | AC012615.1 | 60.55 |
| chr6: 44189440-44189590 | SLC29A1 | 62.87 |
| chr2: 65216400-65216550 | SLC1A4 | 66.42 |
| chr13: 53024200-53024350 | RP11-78J21.4 | 69.05 |
| chr17: 7255280-7255430 | TMEM95 | 69.43 |
| chr17: 7255280-7255430 | KCTD11 | 69.43 |