SOM cluster: 432
Cluster Hypersensitivity Profile

Genomic Location Trend
These plots show the distribution of the DHS sites surrounding the Transcript Start Site of the nearest gene.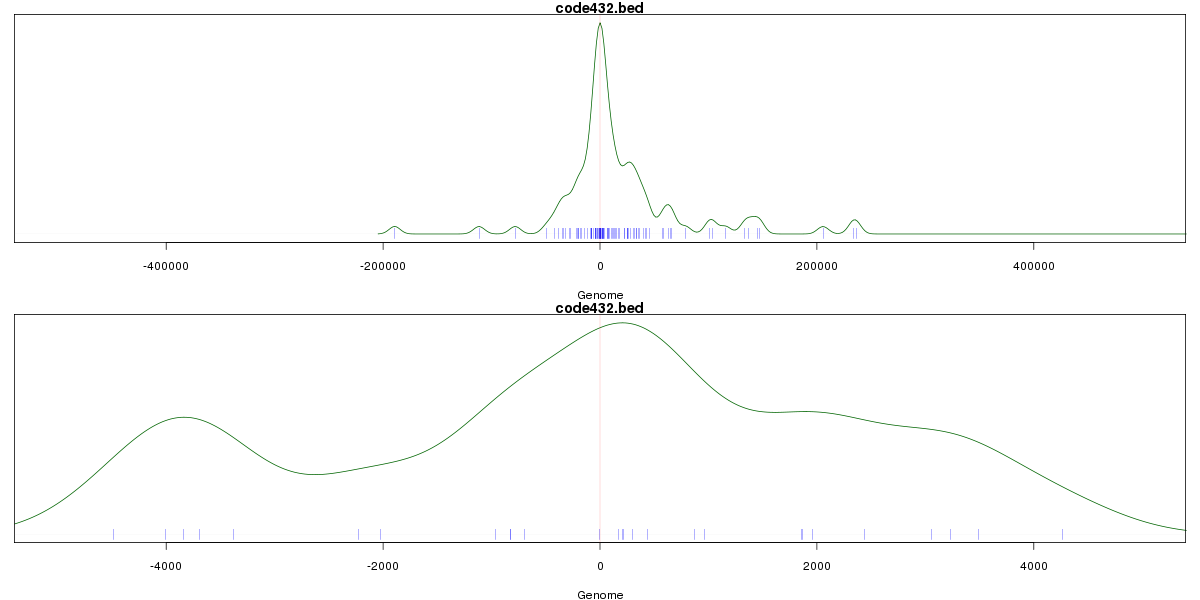
Stats
Number of sites: 239Promoter: 6%
CpG-Island: 11%
Conserved: 31%
Enriched Motifs & Matches
Match Detail: [Jaspar]
|
| ||
|---|---|---|
| Sites: 31/100 | e-val: 0.0000018 | ||
| Factor | e-val(match) | DB |
| SP1 | 0.0000000000026882 | JASPAR |
| Pax4 | 0.000089981 | JASPAR |
| Egr1 | 0.00045164 | JASPAR |
| Klf4 | 0.00058506 | JASPAR |
| EWSR1-FLI1 | 0.0025344 | JASPAR |
|
| ||
| Sites: 44/100 | e-val: 0.13 | ||
| Factor | e-val(match) | DB |
| SPI1 | 0.000088289 | JASPAR |
| EWSR1-FLI1 | 0.00028472 | JASPAR |
| SP1 | 0.00087309 | JASPAR |
| znf143 | 0.0018916 | JASPAR |
| CTCF | 0.0059235 | JASPAR |
|
| ||
| Sites: 24/100 | e-val: 0.01 | ||
| Factor | e-val(match) | DB |
| Egr1 | 0.0035281 | JASPAR |
| INSM1 | 0.0052225 | JASPAR |
| Klf4 | 0.013879 | JASPAR |
| TFAP2A | 0.015074 | JASPAR |
| SP1 | 0.016209 | JASPAR |
BED file downloads
Top 10 Example Regions
| Location | Gene Link | Dist. |
|---|---|---|
| chr13: 100636005-100636155 | ZIC2 | 45.52 |
| chr13: 100636005-100636155 | ZIC5 | 45.52 |
| chr3: 142700080-142700230 | U2SURP | 52.65 |
| chr13: 114995720-114995870 | CLCP2 | 62.86 |
| chr10: 95326300-95326450 | FFAR4 | 63.24 |
| chr16: 71559985-71560135 | CHST4 | 64.54 |
| chrX: 67906020-67906170 | STARD8 | 65.68 |
| chr6: 111187600-111187750 | AMD1 | 66.75 |
| chr16: 50754080-50754230 | NKD1 | 68.39 |
| chr15: 91199405-91199555 | CRTC3 | 69.32 |