SOM cluster: 423
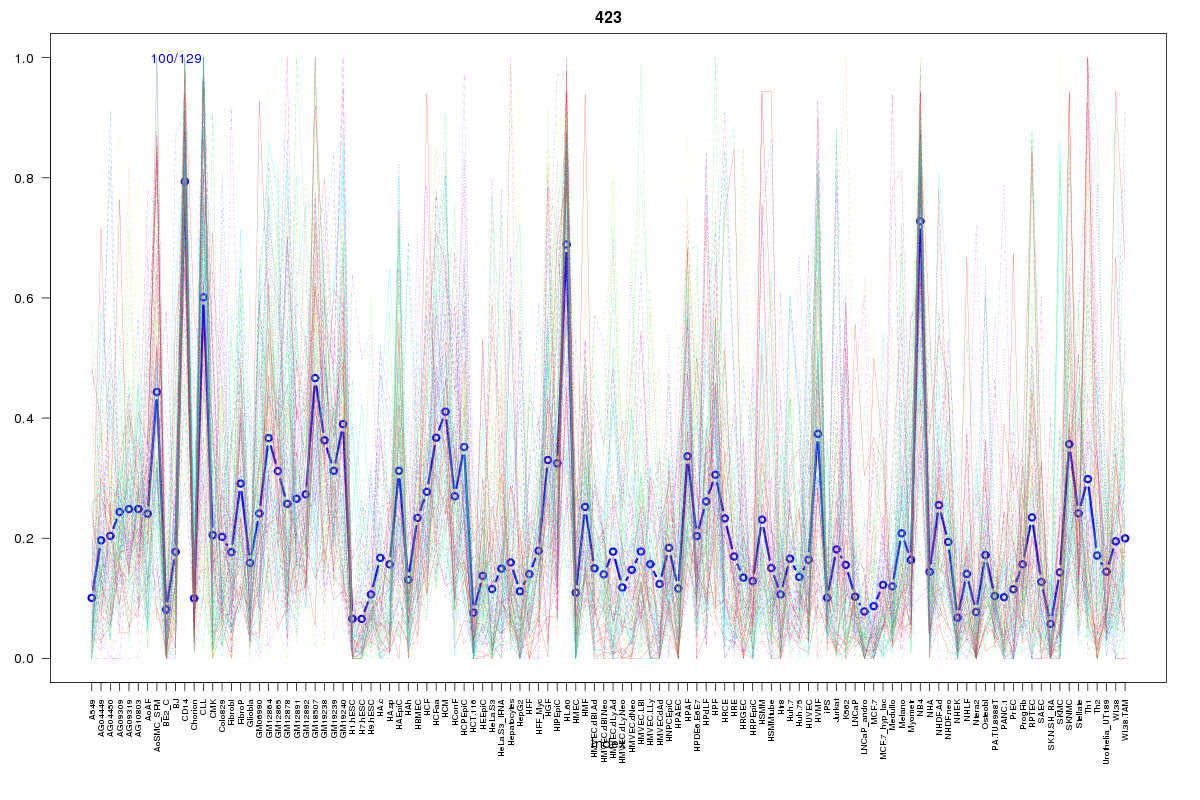
Cluster Hypersensitivity Profile

Genomic Location Trend
These plots show the distribution of the DHS sites surrounding the Transcript Start Site of the nearest gene.
Stats
Number of sites: 129Promoter: 10%
CpG-Island: 6%
Conserved: 36%
Enriched Motifs & Matches
Match Detail: [Jaspar]
|
| ||
|---|---|---|
| Sites: 40/100 | e-val: 0.000000023 | ||
| Factor | e-val(match) | DB |
| SPI1 | 0.0000000031777 | JASPAR |
| SPIB | 0.000000051476 | JASPAR |
| FEV | 0.000006092 | JASPAR |
| ELF5 | 0.000022124 | JASPAR |
| IRF1 | 0.00004524 | JASPAR |
BED file downloads
Top 10 Example Regions
| Location | Gene Link | Dist. |
|---|---|---|
| chr5: 176906400-176906550 | FAM193B | 39.38 |
| chr13: 41627640-41627790 | ELF1 | 56.05 |
| chr13: 41627640-41627790 | KBTBD6 | 56.05 |
| chr10: 45463680-45463830 | RASSF4 | 57.66 |
| chr2: 65459280-65459430 | ACTR2 | 58.46 |
| chr5: 65141260-65141410 | NLN | 63.59 |
| chr4: 40553280-40553430 | RP11-588L15.1 | 67.67 |
| chr21: 40203320-40203470 | AP001042.1 | 69.19 |
| chr8: 121881060-121881210 | SNTB1 | 74.99 |
| chr17: 33814540-33814690 | SLFN14 | 78.72 |