SOM cluster: 42
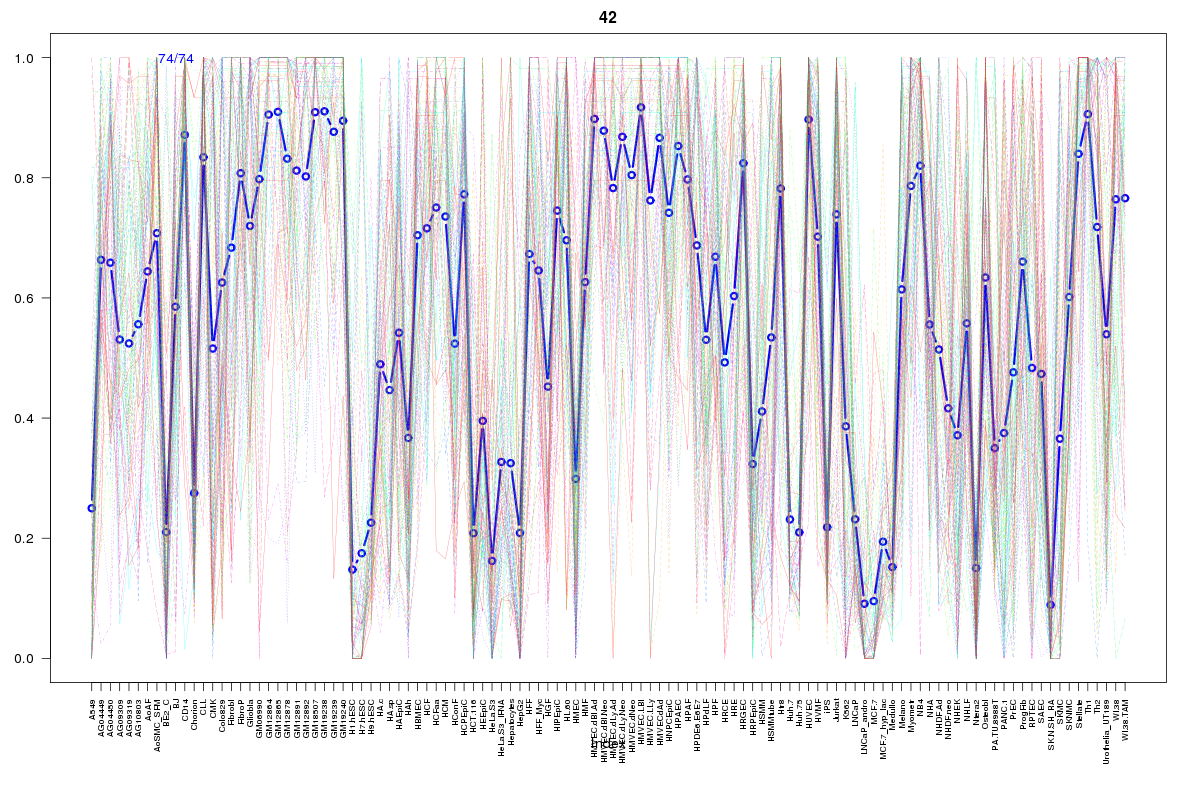
Cluster Hypersensitivity Profile

Genomic Location Trend
These plots show the distribution of the DHS sites surrounding the Transcript Start Site of the nearest gene.
Stats
Number of sites: 74Promoter: 19%
CpG-Island: 2%
Conserved: 45%
Enriched Motifs & Matches
Match Detail: [Jaspar]
|
| ||
|---|---|---|
| Sites: 41/74 | e-val: 1.4e-18 | ||
| Factor | e-val(match) | DB |
| FEV | 0.0000000012492 | JASPAR |
| ELK4 | 0.000000015337 | JASPAR |
| SPI1 | 0.000000039372 | JASPAR |
| GABPA | 0.00000033652 | JASPAR |
| ELF5 | 0.000011751 | JASPAR |
|
| ||
| Sites: 12/74 | e-val: 1.6 | ||
| Factor | e-val(match) | DB |
| IRF1 | 0.000000052567 | JASPAR |
| IRF2 | 0.00000010535 | JASPAR |
| EWSR1-FLI1 | 0.0034915 | JASPAR |
| FEV | 0.0060792 | JASPAR |
| NFATC2 | 0.010584 | JASPAR |
|
| ||
| Sites: 25/74 | e-val: 0.00012 | ||
| Factor | e-val(match) | DB |
| SP1 | 0.000000028032 | JASPAR |
| Klf4 | 0.0000018547 | JASPAR |
| Pax4 | 0.0001683 | JASPAR |
| RREB1 | 0.0017597 | JASPAR |
| Tal1::Gata1 | 0.0067682 | JASPAR |
BED file downloads
Top 10 Example Regions
| Location | Gene Link | Dist. |
|---|---|---|
| chr8: 37595160-37595310 | ERLIN2 | 52.73 |
| chr6: 14877440-14877590 | RP11-146I2.1 | 57.54 |
| chr8: 22103540-22103690 | PIWIL2 | 57.59 |
| chr16: 88767460-88767610 | PIEZO1 | 57.63 |
| chr16: 88767460-88767610 | SNAI3 | 57.63 |
| chr22: 41613840-41613990 | RP4-756G23.5 | 60.65 |
| chr8: 52874840-52874990 | PCMTD1 | 66.9 |
| chr11: 4079460-4079610 | OR55B1P | 67.27 |
| chr19: 50401100-50401250 | U3 | 68.39 |
| chrX: 12968380-12968530 | TMSB4X | 69.18 |