SOM cluster: 39
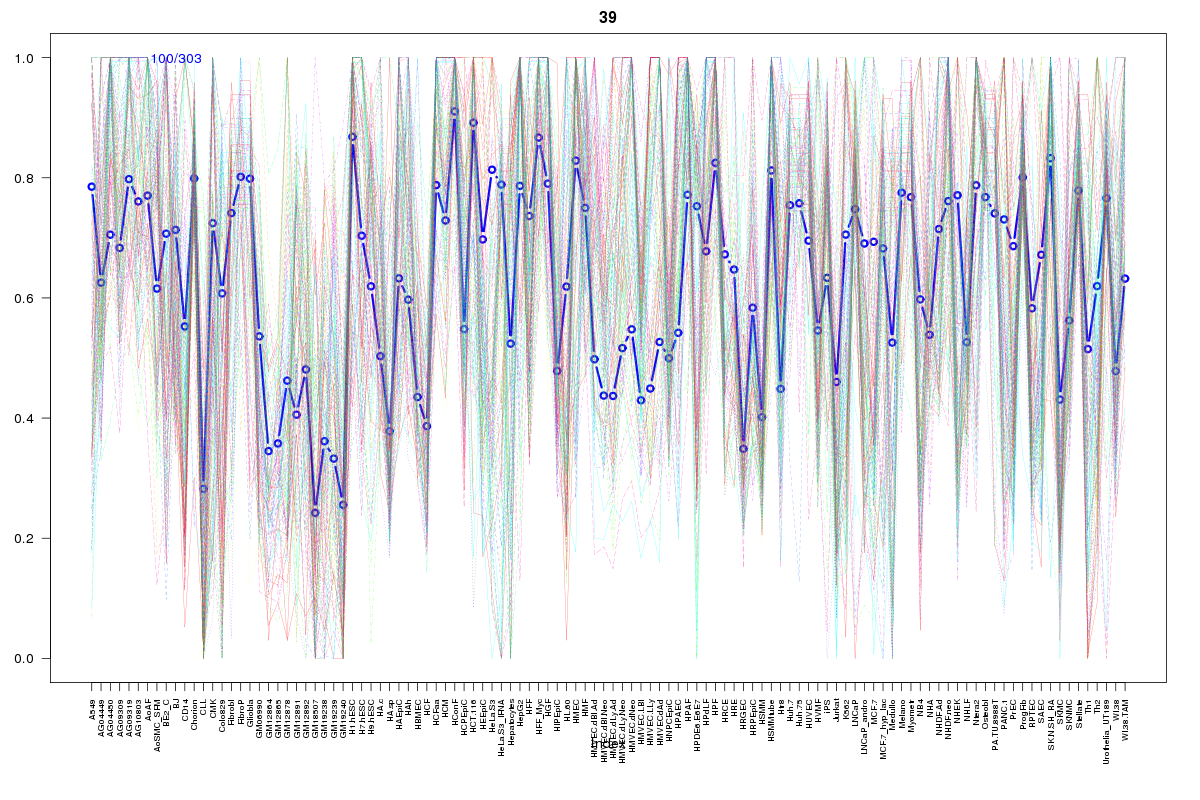
Cluster Hypersensitivity Profile

Genomic Location Trend
These plots show the distribution of the DHS sites surrounding the Transcript Start Site of the nearest gene.
Stats
Number of sites: 303Promoter: 61%
CpG-Island: 70%
Conserved: 88%
Enriched Motifs & Matches
Match Detail: [Jaspar]
|
| ||
|---|---|---|
| Sites: 94/100 | e-val: 0 | ||
| Factor | e-val(match) | DB |
| SP1 | 0.0000027485 | JASPAR |
| Egr1 | 0.0019011 | JASPAR |
| TFAP2A | 0.0022572 | JASPAR |
| PLAG1 | 0.007374 | JASPAR |
| Klf4 | 0.019978 | JASPAR |
|
| ||
| Sites: 50/100 | e-val: 2.8e-33 | ||
| Factor | e-val(match) | DB |
| SP1 | 0.00000023464 | JASPAR |
| Pax4 | 0.0022451 | JASPAR |
| PLAG1 | 0.0036148 | JASPAR |
| RXR::RAR_DR5 | 0.0046297 | JASPAR |
| Klf4 | 0.011088 | JASPAR |
|
| ||
| Sites: 47/100 | e-val: 0.000000000014 | ||
| Factor | e-val(match) | DB |
| SP1 | 0.000015052 | JASPAR |
| TFAP2A | 0.00015555 | JASPAR |
| RREB1 | 0.0035045 | JASPAR |
| Klf4 | 0.0090005 | JASPAR |
| PLAG1 | 0.016486 | JASPAR |
BED file downloads
Top 10 Example Regions
| Location | Gene Link | Dist. |
|---|---|---|
| chr9: 132515260-132515410 | AL590369.1 | 49.06 |
| chr9: 132515260-132515410 | TOR1B | 49.06 |
| chr9: 132515260-132515410 | PTGES | 49.06 |
| chr7: 42277120-42277270 | GLI3 | 53.08 |
| chr3: 126074780-126074930 | RP11-71E19.1 | 54.98 |
| chr3: 126074780-126074930 | KLF15 | 54.98 |
| chr17: 76338120-76338270 | RN7SL236P | 55.04 |
| chr17: 76338120-76338270 | SOCS3 | 55.04 |
| chr17: 76338120-76338270 | SNORA30 | 55.04 |
| chr3: 184286740-184286890 | EPHB3 | 55.1 |