SOM cluster: 386
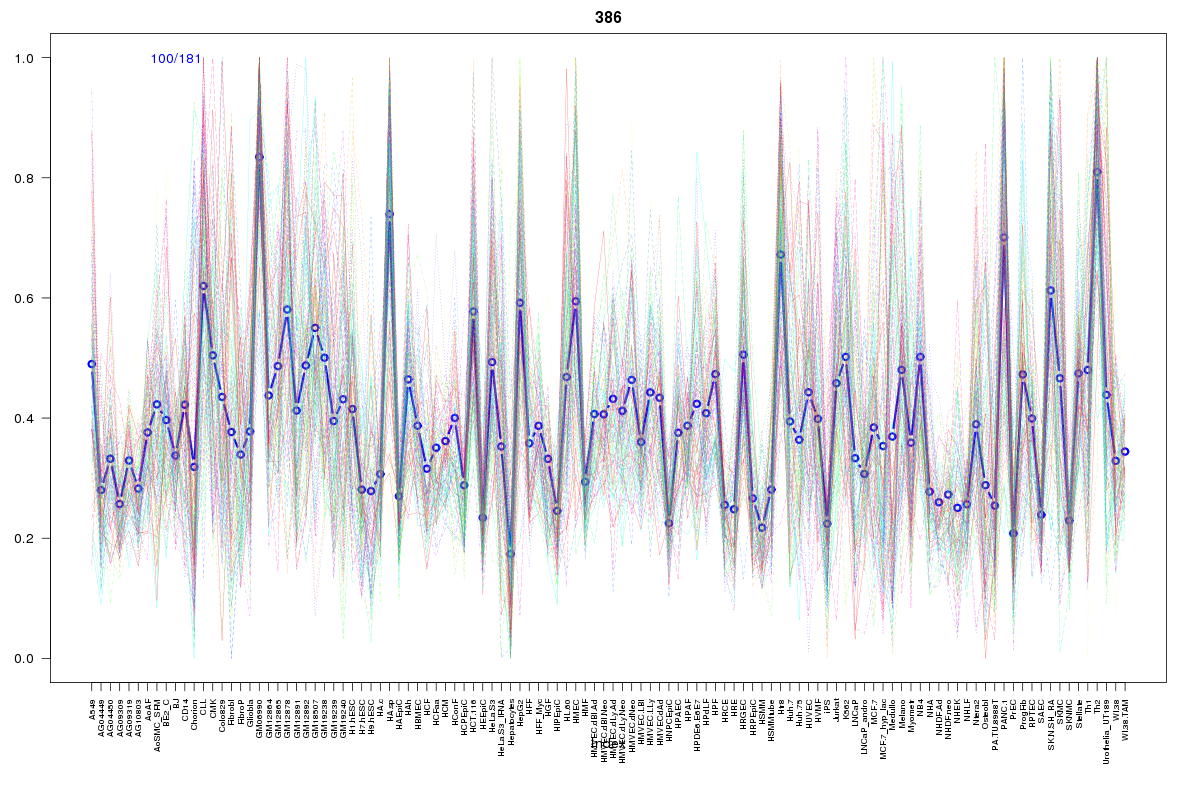
Cluster Hypersensitivity Profile

Genomic Location Trend
These plots show the distribution of the DHS sites surrounding the Transcript Start Site of the nearest gene.
Stats
Number of sites: 181Promoter: 70%
CpG-Island: 69%
Conserved: 41%
Enriched Motifs & Matches
Match Detail: [Jaspar]
|
| ||
|---|---|---|
| Sites: 56/100 | e-val: 0.066 | ||
| Factor | e-val(match) | DB |
| SP1 | 0.000000039437 | JASPAR |
| EWSR1-FLI1 | 0.010201 | JASPAR |
| INSM1 | 0.014484 | JASPAR |
| SPI1 | 0.017293 | JASPAR |
| CTCF | 0.024896 | JASPAR |
BED file downloads
Top 10 Example Regions
| Location | Gene Link | Dist. |
|---|---|---|
| chr1: 145575660-145575810 | RBM8A | 12.99 |
| chr1: 145575660-145575810 | POLR3C | 12.99 |
| chr1: 145575660-145575810 | GNRHR2 | 12.99 |
| chr7: 141438280-141438430 | SSBP1 | 36.04 |
| chr7: 141438280-141438430 | WEE2 | 36.04 |
| chr7: 141438280-141438430 | AGK | 36.04 |
| chr1: 38061200-38061350 | CDCA8 | 39 |
| chr1: 38061200-38061350 | DNALI1 | 39 |
| chr1: 159894080-159894230 | LINC01133 | 59.33 |
| chr1: 159894080-159894230 | IGSF9 | 59.33 |