SOM cluster: 381
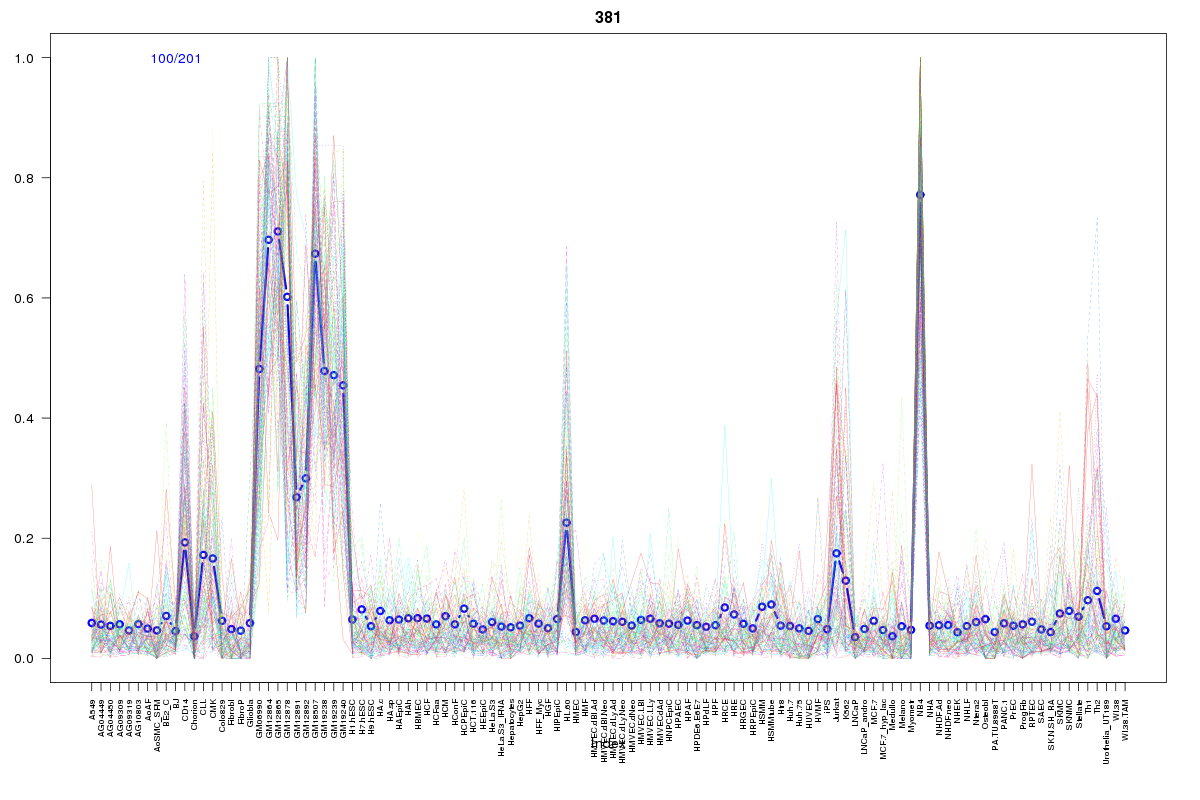
Cluster Hypersensitivity Profile

Genomic Location Trend
These plots show the distribution of the DHS sites surrounding the Transcript Start Site of the nearest gene.
Stats
Number of sites: 201Promoter: 2%
CpG-Island: 0%
Conserved: 27%
Enriched Motifs & Matches
Match Detail: [Jaspar]
|
| ||
|---|---|---|
| Sites: 15/100 | e-val: 0.00000014 | ||
| Factor | e-val(match) | DB |
| SPI1 | 0.0000000087082 | JASPAR |
| SPIB | 0.00000012945 | JASPAR |
| FEV | 0.0000032795 | JASPAR |
| ELF5 | 0.000029979 | JASPAR |
| GABPA | 0.000218 | JASPAR |
BED file downloads
Top 10 Example Regions
| Location | Gene Link | Dist. |
|---|---|---|
| chr16: 11348060-11348210 | RMI2 | 37.01 |
| chr16: 11348060-11348210 | snoU13 | 37.01 |
| chr13: 46269360-46269510 | LINC01055 | 39.72 |
| chr13: 46269360-46269510 | AKR1B1P4 | 39.72 |
| chr7: 106535700-106535850 | PIK3CG | 45.08 |
| chr12: 19635740-19635890 | AEBP2 | 47.35 |
| chr12: 27375040-27375190 | STK38L | 49.19 |
| chr8: 135731860-135732010 | ZFAT | 56.09 |
| chr11: 121428200-121428350 | SORL1 | 56.23 |
| chr7: 128762920-128763070 | TSPAN33 | 61.93 |