SOM cluster: 379
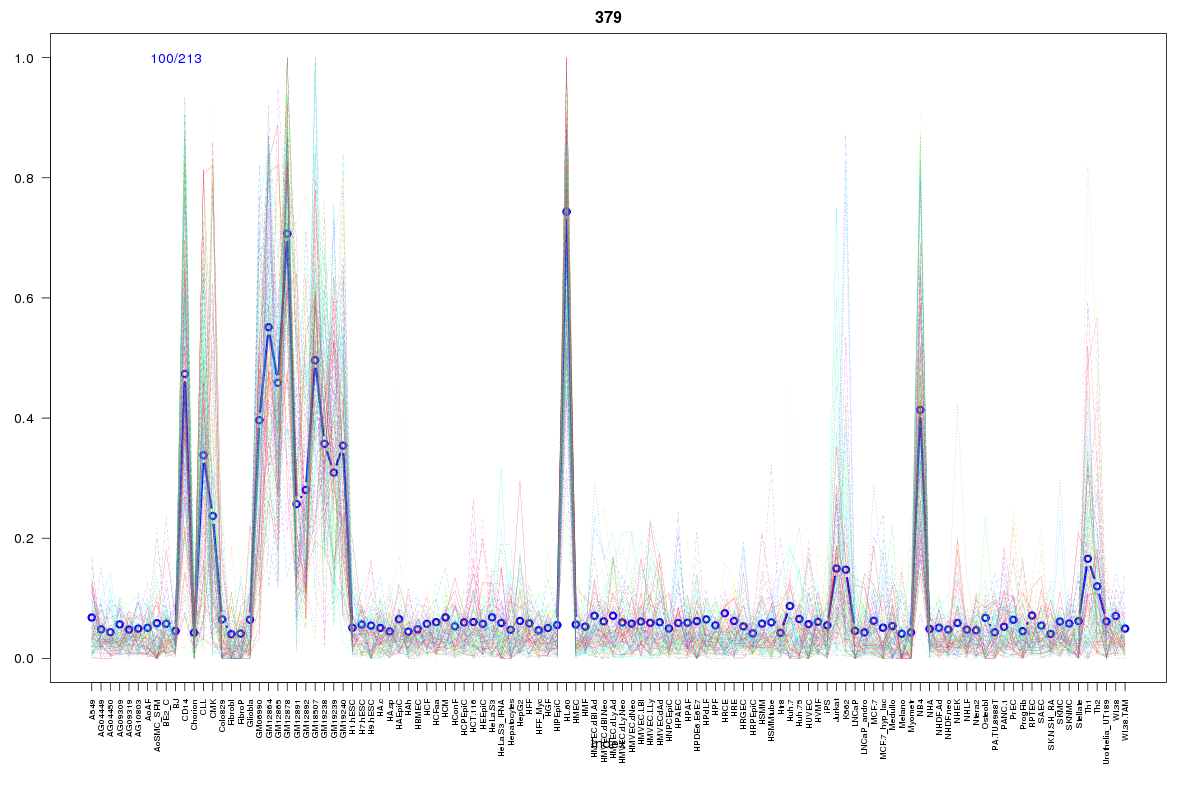
Cluster Hypersensitivity Profile

Genomic Location Trend
These plots show the distribution of the DHS sites surrounding the Transcript Start Site of the nearest gene.
Stats
Number of sites: 213Promoter: 11%
CpG-Island: 1%
Conserved: 28%
Enriched Motifs & Matches
Match Detail: [Jaspar]
|
| ||
|---|---|---|
| Sites: 34/100 | e-val: 0.0000000000000019 | ||
| Factor | e-val(match) | DB |
| SPI1 | 0.00000001454 | JASPAR |
| SPIB | 0.0000002941 | JASPAR |
| FEV | 0.000030314 | JASPAR |
| GABPA | 0.00018401 | JASPAR |
| ELF5 | 0.00022276 | JASPAR |
BED file downloads
Top 10 Example Regions
| Location | Gene Link | Dist. |
|---|---|---|
| chr1: 156124005-156124155 | SEMA4A | 44.32 |
| chr1: 156124005-156124155 | BGLAP | 44.32 |
| chr1: 156124005-156124155 | LMNA | 44.32 |
| chr13: 99987960-99988110 | GPR18 | 53.78 |
| chr13: 99987960-99988110 | GPR183 | 53.78 |
| chr10: 97549780-97549930 | ENTPD1 | 54.14 |
| chr10: 97549780-97549930 | RP11-429G19.3 | 54.14 |
| chr19: 17249420-17249570 | NR2F6 | 54.73 |
| chr19: 17249420-17249570 | HAUS8 | 54.73 |
| chr6: 31582200-31582350 | LST1 | 54.93 |