SOM cluster: 36
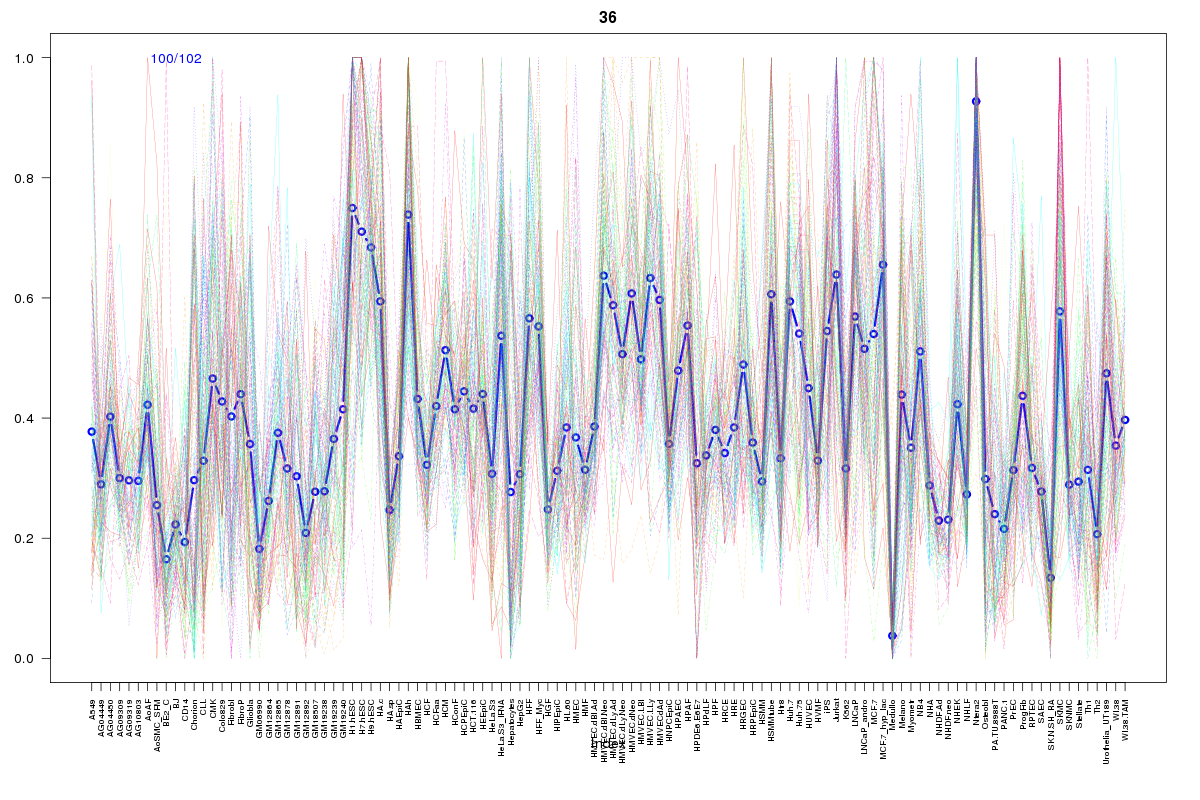
Cluster Hypersensitivity Profile

Genomic Location Trend
These plots show the distribution of the DHS sites surrounding the Transcript Start Site of the nearest gene.
Stats
Number of sites: 102Promoter: 4%
CpG-Island: 2%
Conserved: 85%
Enriched Motifs & Matches
Match Detail: [Jaspar]
|
| ||
|---|---|---|
| Sites: 88/100 | e-val: 0 | ||
| Factor | e-val(match) | DB |
| REST | 0 | JASPAR |
| TLX1::NFIC | 0.0025723 | JASPAR |
| RXR::RAR_DR5 | 0.0038309 | JASPAR |
| SOX9 | 0.02542 | JASPAR |
| Mafb | 0.033049 | JASPAR |
|
| ||
| Sites: 21/100 | e-val: 0.000000000000032 | ||
| Factor | e-val(match) | DB |
| REST | 0.00000000060146 | JASPAR |
| REL | 0.00035671 | JASPAR |
| NHLH1 | 0.003611 | JASPAR |
| Myf | 0.0050632 | JASPAR |
| NF-kappaB | 0.0079777 | JASPAR |
|
| ||
| Sites: 32/100 | e-val: 0.11 | ||
| Factor | e-val(match) | DB |
| REST | 0.00000001823 | JASPAR |
| NFE2L2 | 0.000080153 | JASPAR |
| Mafb | 0.00048295 | JASPAR |
| BRCA1 | 0.0034653 | JASPAR |
| MYC::MAX | 0.0078098 | JASPAR |
BED file downloads
Top 10 Example Regions
| Location | Gene Link | Dist. |
|---|---|---|
| chr8: 10950020-10950170 | XKR6 | 33.78 |
| chr8: 10950020-10950170 | AF131215.2 | 33.78 |
| chr8: 10950020-10950170 | AF131215.5 | 33.78 |
| chr8: 10950020-10950170 | AF131215.4 | 33.78 |
| chr8: 10950020-10950170 | AF131215.3 | 33.78 |
| chr11: 74944800-74944950 | ARRB1 | 50.85 |
| chr6: 39056220-39056370 | GLP1R | 62.8 |
| chr20: 61546380-61546530 | ARF4P2 | 71.34 |
| chr20: 61546380-61546530 | COL9A3 | 71.34 |
| chr20: 61546380-61546530 | BHLHE23 | 71.34 |