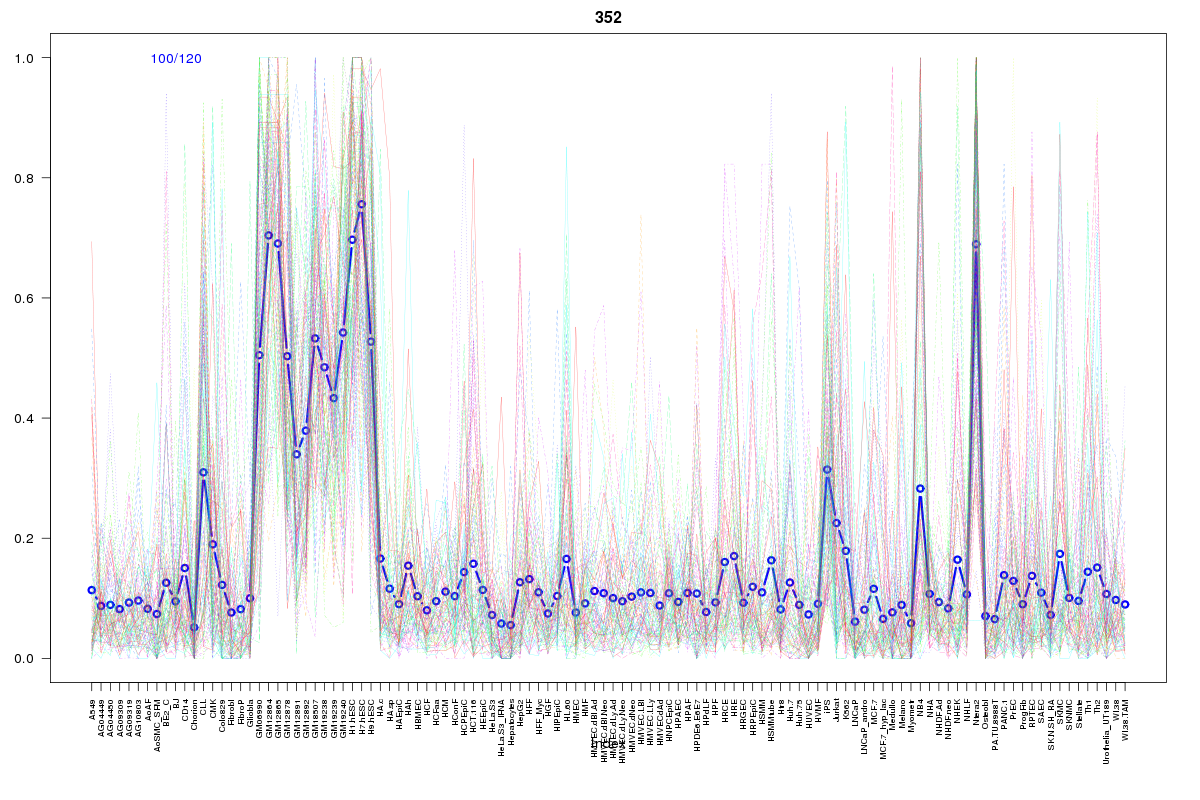
SOM cluster: 352
Cluster Hypersensitivity Profile

Genomic Location Trend
These plots show the distribution of the DHS sites surrounding the Transcript Start Site of the nearest gene.
Stats
Number of sites: 120Promoter: 5%
CpG-Island: 5%
Conserved: 43%
Enriched Motifs & Matches
Match Detail: [Jaspar]
|
| ||
|---|---|---|
| Sites: 25/100 | e-val: 0.45 | ||
| Factor | e-val(match) | DB |
| SP1 | 0.0000000000014373 | JASPAR |
| Pax4 | 0.0000012963 | JASPAR |
| MZF1_5-13 | 0.0000012976 | JASPAR |
| RREB1 | 0.00053408 | JASPAR |
| MZF1_1-4 | 0.00073407 | JASPAR |