SOM cluster: 345
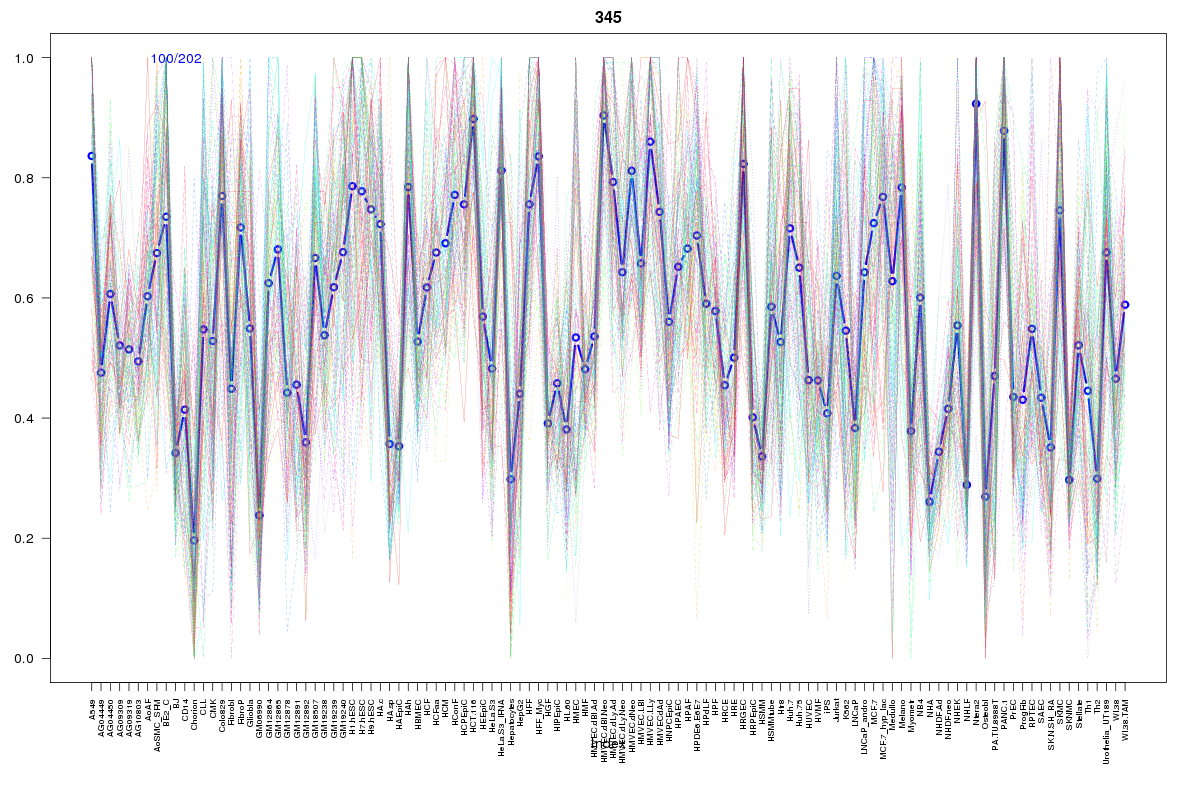
Cluster Hypersensitivity Profile

Genomic Location Trend
These plots show the distribution of the DHS sites surrounding the Transcript Start Site of the nearest gene.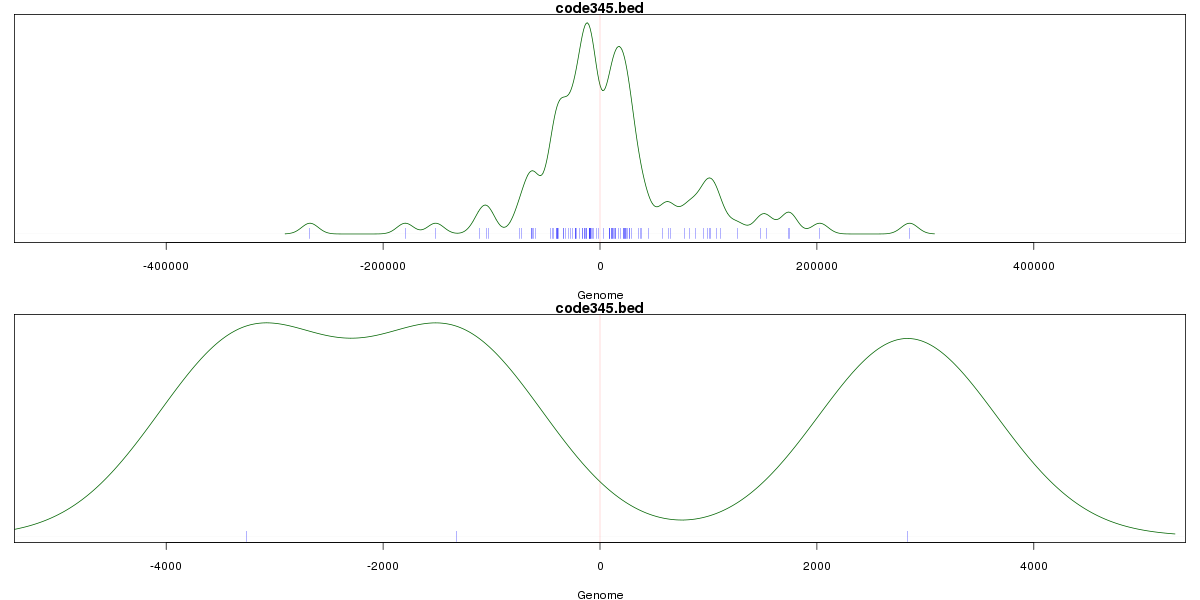
Stats
Number of sites: 202Promoter: 1%
CpG-Island: 0%
Conserved: 82%
Enriched Motifs & Matches
Match Detail: [Jaspar]
|
| ||
|---|---|---|
| Sites: 94/100 | e-val: 0 | ||
| Factor | e-val(match) | DB |
| CTCF | 0 | JASPAR |
| Zfp423 | 0.0010666 | JASPAR |
| INSM1 | 0.0011415 | JASPAR |
| T | 0.0024831 | JASPAR |
| TAL1::TCF3 | 0.0046586 | JASPAR |
BED file downloads
Top 10 Example Regions
| Location | Gene Link | Dist. |
|---|---|---|
| chr7: 42980960-42981110 | PSMA2 | 50.56 |
| chr7: 42980960-42981110 | PSMA2 | 50.56 |
| chr9: 104221400-104221550 | FYTTD1P1 | 51.82 |
| chr9: 104221400-104221550 | TMEM246 | 51.82 |
| chr11: 32830860-32831010 | QSER1 | 54.65 |
| chr1: 172398580-172398730 | C1orf105 | 55.34 |
| chr9: 33374980-33375130 | CHMP5 | 65.49 |
| chr13: 25688420-25688570 | AL359757.1 | 66.93 |
| chr15: 93064920-93065070 | FAM174B | 67.93 |
| chr3: 112754360-112754510 | CD200R1 | 69.29 |