SOM cluster: 343
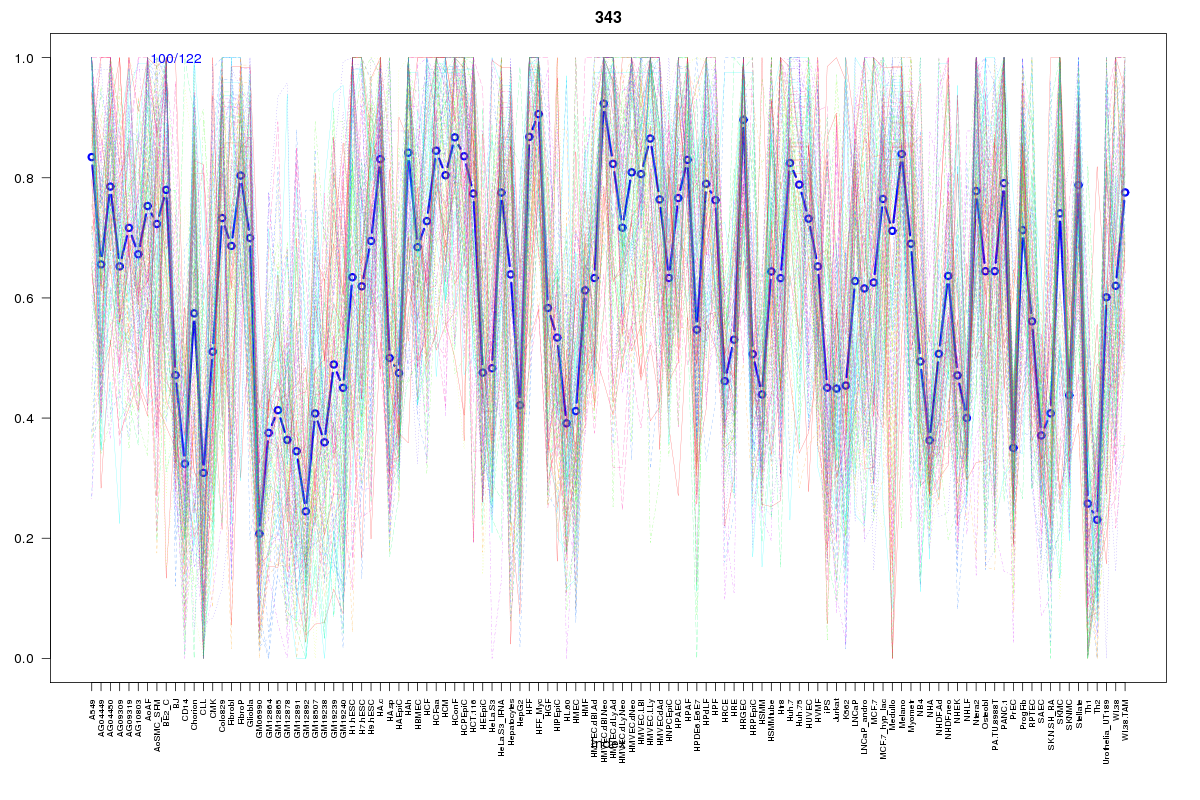
Cluster Hypersensitivity Profile

Genomic Location Trend
These plots show the distribution of the DHS sites surrounding the Transcript Start Site of the nearest gene.
Stats
Number of sites: 122Promoter: 12%
CpG-Island: 5%
Conserved: 77%
Enriched Motifs & Matches
Match Detail: [Jaspar]
|
| ||
|---|---|---|
| Sites: 77/100 | e-val: 0 | ||
| Factor | e-val(match) | DB |
| CTCF | 0.00000000000038047 | JASPAR |
| INSM1 | 0.00087839 | JASPAR |
| Zfp423 | 0.0043052 | JASPAR |
| TAL1::TCF3 | 0.014956 | JASPAR |
| T | 0.031181 | JASPAR |
|
| ||
| Sites: 93/100 | e-val: 1.6 | ||
| Factor | e-val(match) | DB |
| NFATC2 | 0.0000003212 | JASPAR |
| Stat3 | 0.000019328 | JASPAR |
| FEV | 0.000063176 | JASPAR |
| znf143 | 0.00079034 | JASPAR |
| NF-kappaB | 0.001199 | JASPAR |
BED file downloads
Top 10 Example Regions
| Location | Gene Link | Dist. |
|---|---|---|
| chr8: 42177280-42177430 | DKK4 | 37.49 |
| chr9: 130352260-130352410 | STXBP1 | 42.07 |
| chr5: 176038440-176038590 | EIF4E1B | 46.44 |
| chr5: 176038440-176038590 | RN7SL684P | 46.44 |
| chr5: 176038440-176038590 | RNF44 | 46.44 |
| chr7: 116594360-116594510 | ST7-AS1 | 52.26 |
| chr7: 116594360-116594510 | Y_RNA | 52.26 |
| chr2: 66802540-66802690 | MEIS1 | 60.26 |
| chr19: 54480860-54481010 | CACNG7 | 60.98 |
| chr19: 54480860-54481010 | CACNG8 | 60.98 |