SOM cluster: 330
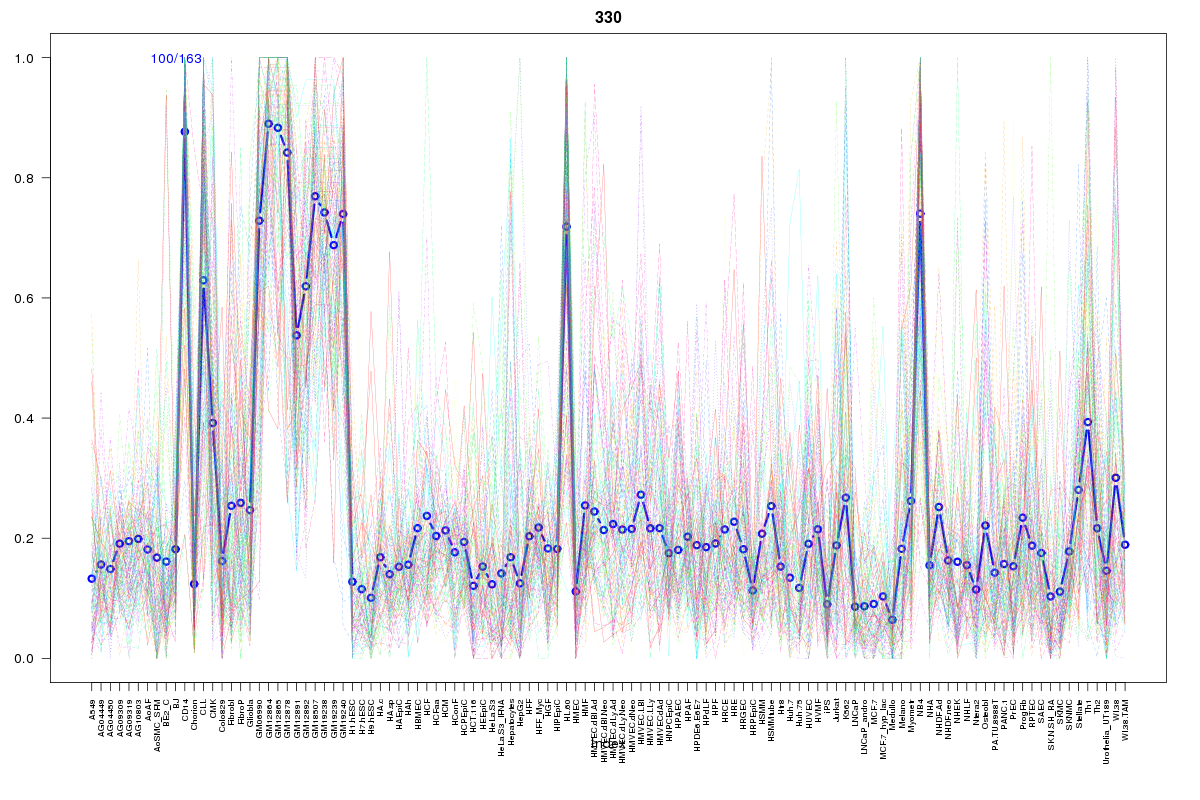
Cluster Hypersensitivity Profile

Genomic Location Trend
These plots show the distribution of the DHS sites surrounding the Transcript Start Site of the nearest gene.
Stats
Number of sites: 163Promoter: 13%
CpG-Island: 3%
Conserved: 39%
Enriched Motifs & Matches
Match Detail: [Jaspar]
|
| ||
|---|---|---|
| Sites: 53/100 | e-val: 1e-27 | ||
| Factor | e-val(match) | DB |
| SPI1 | 0.00000009314 | JASPAR |
| IRF1 | 0.00000038701 | JASPAR |
| SPIB | 0.0000022296 | JASPAR |
| FEV | 0.000013684 | JASPAR |
| IRF2 | 0.000068888 | JASPAR |
|
| ||
| Sites: 24/100 | e-val: 0.00012 | ||
| Factor | e-val(match) | DB |
| SP1 | 0.00017467 | JASPAR |
| EWSR1-FLI1 | 0.0010229 | JASPAR |
| Tal1::Gata1 | 0.001321 | JASPAR |
| MZF1_1-4 | 0.0022905 | JASPAR |
| Pax4 | 0.0066621 | JASPAR |
BED file downloads
Top 10 Example Regions
| Location | Gene Link | Dist. |
|---|---|---|
| chr19: 14495120-14495270 | CD97 | 48.23 |
| chr19: 14495120-14495270 | GIPC1 | 48.23 |
| chr19: 14495120-14495270 | DDX39A | 48.23 |
| chr11: 111809640-111809790 | FDXACB1 | 52.07 |
| chr11: 111809640-111809790 | C11orf52 | 52.07 |
| chr11: 111809640-111809790 | HSPB2-C11orf52 | 52.07 |
| chr11: 111809640-111809790 | RP11-708L7.6 | 52.07 |
| chr4: 102711780-102711930 | BANK1 | 52.71 |
| chr1: 207999440-207999590 | C1orf132 | 57.25 |
| chr15: 90574680-90574830 | ZNF710 | 57.96 |