SOM cluster: 323
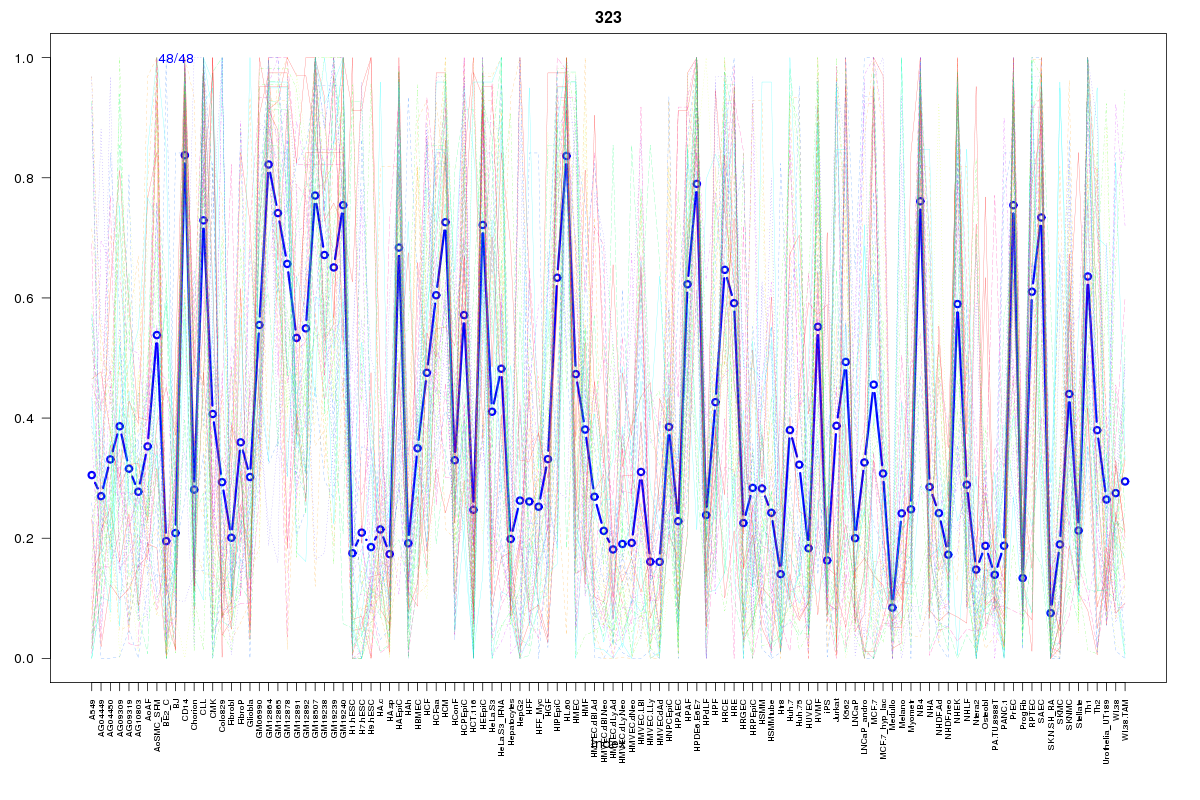
Cluster Hypersensitivity Profile

Genomic Location Trend
These plots show the distribution of the DHS sites surrounding the Transcript Start Site of the nearest gene.
Stats
Number of sites: 48Promoter: 8%
CpG-Island: 1%
Conserved: 25%
Enriched Motifs & Matches
No motifs found.BED file downloads
Top 10 Example Regions
| Location | Gene Link | Dist. |
|---|---|---|
| chr1: 182557960-182558110 | RNASEL | 52.22 |
| chr3: 48264800-48264950 | NDUFB1P1 | 56.54 |
| chr3: 48264800-48264950 | Y_RNA | 56.54 |
| chr11: 63656040-63656190 | MARK2 | 66.85 |
| chr6: 6918980-6919130 | RP3-429O6.1 | 70.81 |
| chr7: 140356440-140356590 | Y_RNA | 72.03 |
| chr17: 76268760-76268910 | RN7SL236P | 74.59 |
| chr19: 17961440-17961590 | FCHO1 | 75.34 |
| chr19: 17961440-17961590 | SNORA68 | 75.34 |
| chr19: 17961440-17961590 | JAK3 | 75.34 |