SOM cluster: 321
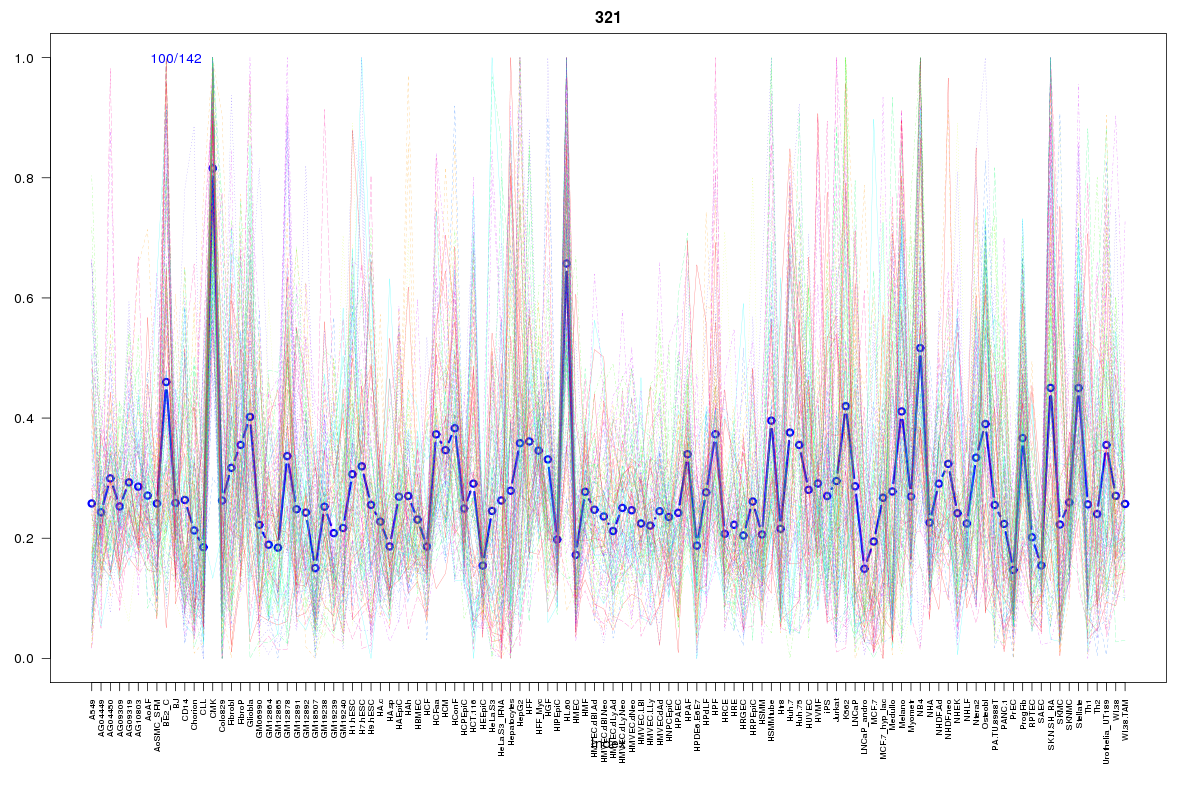
Cluster Hypersensitivity Profile

Genomic Location Trend
These plots show the distribution of the DHS sites surrounding the Transcript Start Site of the nearest gene.
Stats
Number of sites: 142Promoter: 35%
CpG-Island: 23%
Conserved: 48%
Enriched Motifs & Matches
Match Detail: [Jaspar]
|
| ||
|---|---|---|
| Sites: 83/100 | e-val: 1.49995e-41 | ||
| Factor | e-val(match) | DB |
| SP1 | 0.00000093381 | JASPAR |
| Klf4 | 0.000035931 | JASPAR |
| Pax4 | 0.0017044 | JASPAR |
| MZF1_1-4 | 0.020741 | JASPAR |
| RREB1 | 0.023172 | JASPAR |
|
| ||
| Sites: 23/100 | e-val: 0.84 | ||
| Factor | e-val(match) | DB |
| SP1 | 0.000048596 | JASPAR |
| MZF1_5-13 | 0.00046382 | JASPAR |
| MZF1_1-4 | 0.0021138 | JASPAR |
| SPI1 | 0.0022791 | JASPAR |
| PLAG1 | 0.0031327 | JASPAR |
BED file downloads
Top 10 Example Regions
| Location | Gene Link | Dist. |
|---|---|---|
| chr1: 182271000-182271150 | GLUL | 47.13 |
| chr9: 139267480-139267630 | CARD9 | 48.18 |
| chr10: 94459440-94459590 | KIF11 | 48.42 |
| chr1: 159892760-159892910 | SLAMF9 | 49.33 |
| chr19: 56989585-56989735 | ZFP28 | 67.77 |
| chr19: 56989585-56989735 | ZNF470 | 67.77 |
| chr19: 56989585-56989735 | ZNF667-AS1 | 67.77 |
| chr19: 56989585-56989735 | ZNF667 | 67.77 |
| chr19: 56989585-56989735 | ZNF471 | 67.77 |
| chr8: 121824280-121824430 | SNTB1 | 70.28 |