SOM cluster: 316
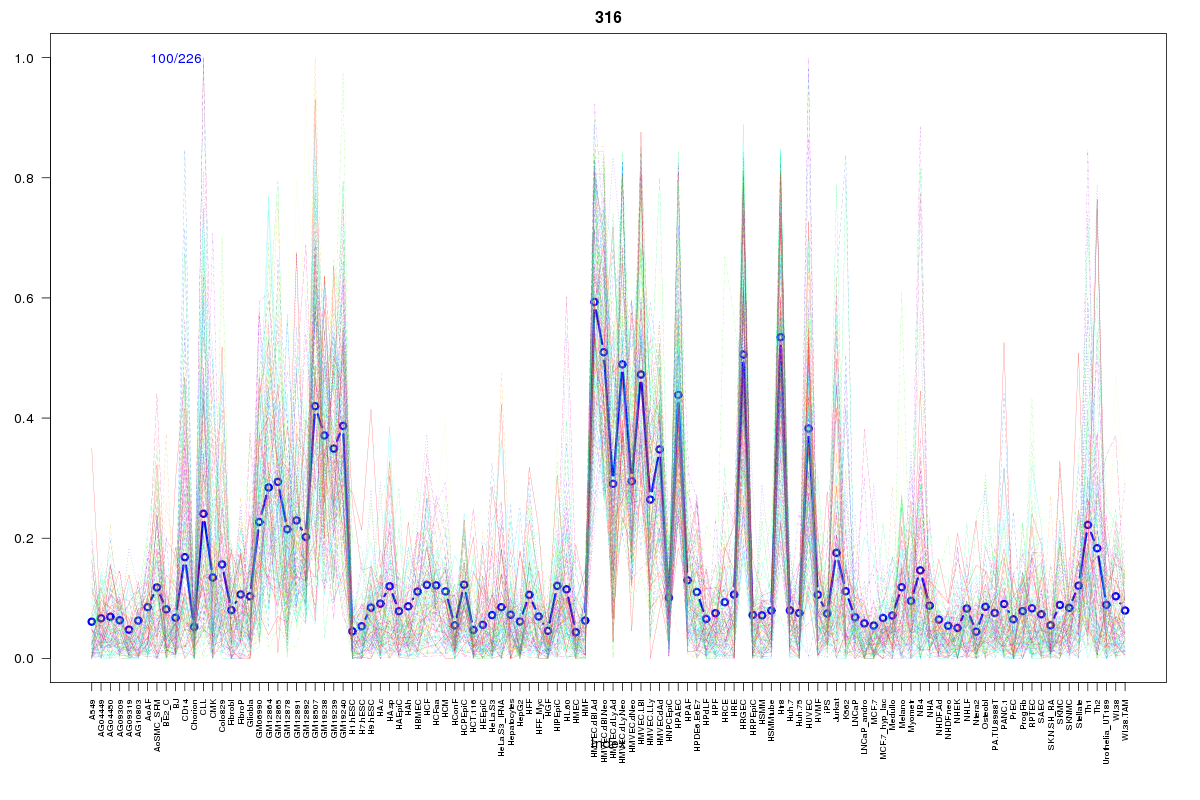
Cluster Hypersensitivity Profile

Genomic Location Trend
These plots show the distribution of the DHS sites surrounding the Transcript Start Site of the nearest gene.
Stats
Number of sites: 226Promoter: 2%
CpG-Island: 0%
Conserved: 40%
Enriched Motifs & Matches
Match Detail: [Jaspar]
|
| ||
|---|---|---|
| Sites: 58/100 | e-val: 1.1e-25 | ||
| Factor | e-val(match) | DB |
| FEV | 0.000000000027058 | JASPAR |
| SPI1 | 0.00000039861 | JASPAR |
| ELK4 | 0.00000080832 | JASPAR |
| ELF5 | 0.0000040588 | JASPAR |
| SPIB | 0.000011844 | JASPAR |
BED file downloads
Top 10 Example Regions
| Location | Gene Link | Dist. |
|---|---|---|
| chr5: 142113740-142113890 | FGF1 | 39.18 |
| chr5: 142113740-142113890 | ARHGAP26 | 39.18 |
| chr5: 142113740-142113890 | AC005592.1 | 39.18 |
| chr8: 127512200-127512350 | RP11-103H7.2 | 45.88 |
| chr1: 66731640-66731790 | PDE4B | 53.91 |
| chr8: 6418840-6418990 | ANGPT2 | 57.02 |
| chr2: 161934400-161934550 | TANK | 57.17 |
| chr6: 126115140-126115290 | NCOA7-AS1 | 66.45 |
| chr6: 126115140-126115290 | NCOA7 | 66.45 |
| chr6: 126115140-126115290 | RN7SKP56 | 66.45 |