SOM cluster: 311
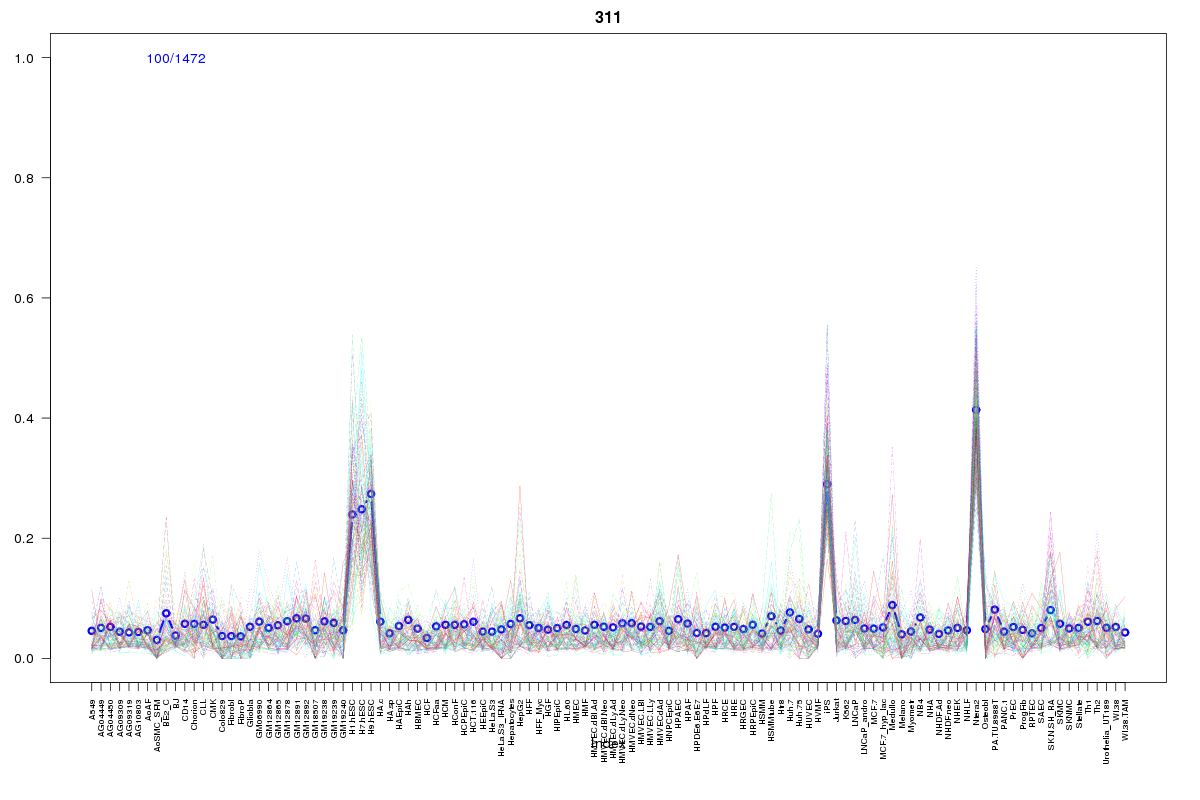
Cluster Hypersensitivity Profile

Genomic Location Trend
These plots show the distribution of the DHS sites surrounding the Transcript Start Site of the nearest gene.
Stats
Number of sites: 1472Promoter: 7%
CpG-Island: 7%
Conserved: 30%
Enriched Motifs & Matches
Match Detail: [Jaspar]
|
| ||
|---|---|---|
| Sites: 55/100 | e-val: 9.52883e-44 | ||
| Factor | e-val(match) | DB |
| SP1 | 0.00000012559 | JASPAR |
| Pax4 | 0.00012521 | JASPAR |
| EWSR1-FLI1 | 0.00019233 | JASPAR |
| PLAG1 | 0.00053495 | JASPAR |
| MZF1_5-13 | 0.0021125 | JASPAR |
BED file downloads
Top 10 Example Regions
| Location | Gene Link | Dist. |
|---|---|---|
| chr1: 151101400-151101550 | PIP5K1A | 24.27 |
| chr1: 151101400-151101550 | VPS72 | 24.27 |
| chr5: 150554245-150554395 | TNIP1 | 39.54 |
| chrX: 47674380-47674530 | WASF4P | 41.59 |
| chr11: 63551465-63551615 | C11orf95 | 43.14 |
| chr11: 63551465-63551615 | C11orf84 | 43.14 |
| chr1: 203185720-203185870 | NPM1P40 | 45.74 |
| chr3: 148915540-148915690 | HPS3 | 47.3 |
| chr2: 235920405-235920555 | AC010148.1 | 48.57 |
| chr2: 97577780-97577930 | ANKRD23 | 49.72 |