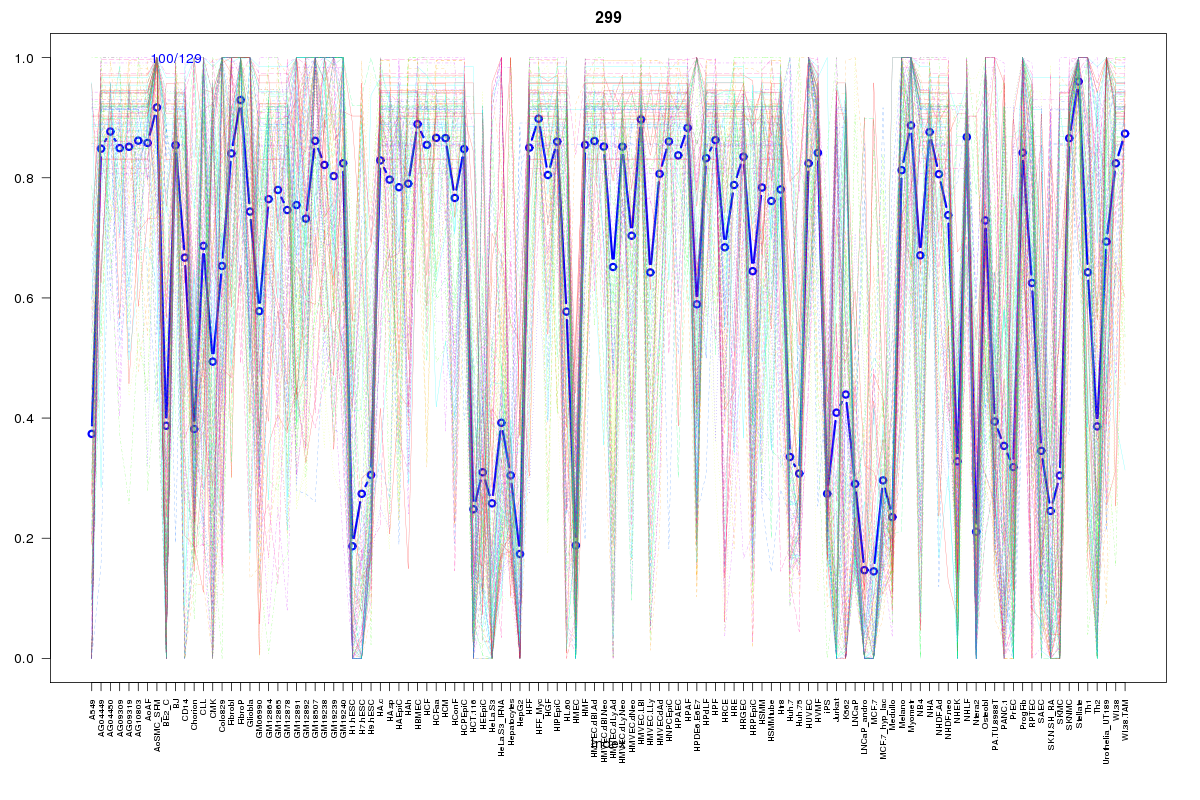
SOM cluster: 299
Cluster Hypersensitivity Profile

Genomic Location Trend
These plots show the distribution of the DHS sites surrounding the Transcript Start Site of the nearest gene.
Stats
Number of sites: 129Promoter: 9%
CpG-Island: 5%
Conserved: 77%
Enriched Motifs & Matches
Match Detail: [Jaspar]
|
| ||
|---|---|---|
| Sites: 27/100 | e-val: 0.000014 | ||
| Factor | e-val(match) | DB |
| SPIB | 0.0000012432 | JASPAR |
| SP1 | 0.0000041961 | JASPAR |
| SPI1 | 0.000059956 | JASPAR |
| EWSR1-FLI1 | 0.000062298 | JASPAR |
| Pax4 | 0.00016045 | JASPAR |
|
| ||
| Sites: 21/100 | e-val: 0.0058 | ||
| Factor | e-val(match) | DB |
| AP1 | 0.000000000025742 | JASPAR |
| NFE2L2 | 0.0000000068398 | JASPAR |
| PPARG | 0.0025385 | JASPAR |
| NFE2L1::MafG | 0.0047519 | JASPAR |
| RORA_2 | 0.013255 | JASPAR |
|
| ||
| Sites: 23/100 | e-val: 1 | ||
| Factor | e-val(match) | DB |
| RREB1 | 0.000030161 | JASPAR |
| SP1 | 0.000092701 | JASPAR |
| Pax4 | 0.00024085 | JASPAR |
| INSM1 | 0.00056413 | JASPAR |
| Tal1::Gata1 | 0.0015257 | JASPAR |
|
| ||
| Sites: 15/100 | e-val: 2.5 | ||
| Factor | e-val(match) | DB |
| RUNX1 | 0.00000040034 | JASPAR |
| FOXO3 | 0.0034902 | JASPAR |
| ZNF354C | 0.0040556 | JASPAR |
| FOXD1 | 0.0080116 | JASPAR |
| IRF1 | 0.021666 | JASPAR |
BED file downloads
Top 10 Example Regions
| Location | Gene Link | Dist. |
|---|---|---|
| chr12: 8088920-8089070 | SLC2A3 | 33.3 |
| chr12: 8088920-8089070 | SLC2A14 | 33.3 |
| chr1: 151030300-151030450 | ANXA9 | 47.27 |
| chr1: 151030300-151030450 | CERS2 | 47.27 |
| chr1: 151030300-151030450 | PRUNE | 47.27 |
| chr1: 151030300-151030450 | BNIPL | 47.27 |
| chr1: 151030300-151030450 | SETDB1 | 47.27 |
| chr1: 151030300-151030450 | RP11-316M1.12 | 47.27 |
| chr3: 47308300-47308450 | KIF9-AS1 | 47.61 |
| chr16: 87498400-87498550 | MAP1LC3B | 50.49 |