SOM cluster: 289
Cluster Hypersensitivity Profile

Genomic Location Trend
These plots show the distribution of the DHS sites surrounding the Transcript Start Site of the nearest gene.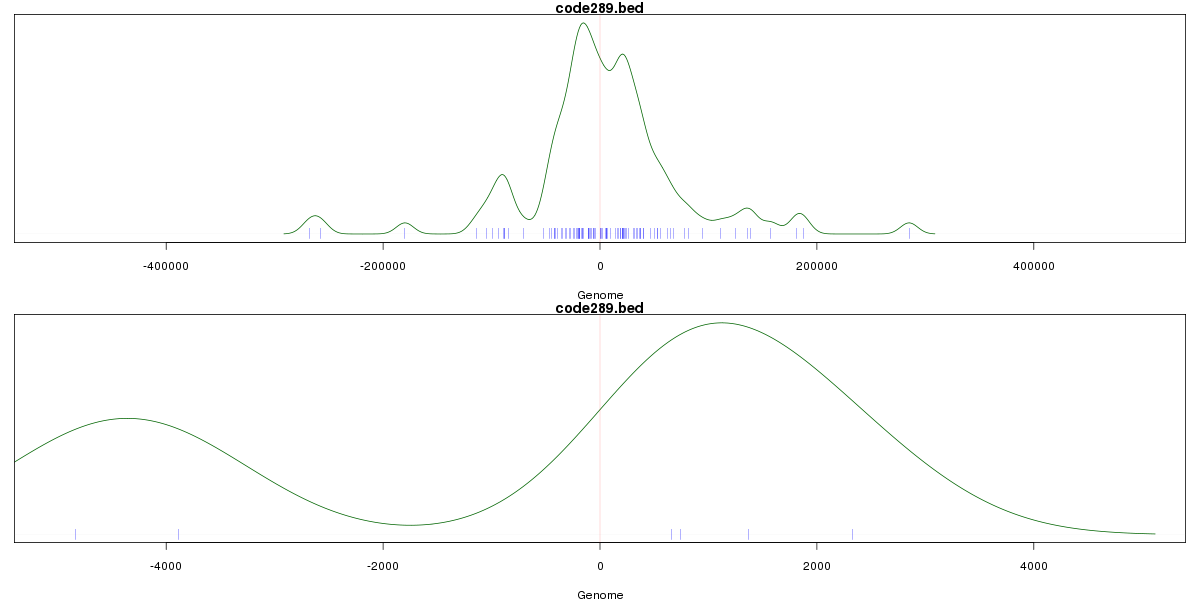
Stats
Number of sites: 201Promoter: 0%
CpG-Island: 0%
Conserved: 70%
Enriched Motifs & Matches
Match Detail: [Jaspar]
|
| ||
|---|---|---|
| Sites: 86/100 | e-val: 0 | ||
| Factor | e-val(match) | DB |
| CTCF | 0.0000000000000042188 | JASPAR |
| INSM1 | 0.0000035922 | JASPAR |
| MYC::MAX | 0.0035327 | JASPAR |
| TAL1::TCF3 | 0.0041096 | JASPAR |
| Zfp423 | 0.0053961 | JASPAR |
BED file downloads
Top 10 Example Regions
| Location | Gene Link | Dist. |
|---|---|---|
| chr11: 16967560-16967710 | PLEKHA7 | 38.58 |
| chr7: 39559620-39559770 | YAE1D1 | 53.76 |
| chr17: 55087500-55087650 | AKAP1 | 54.74 |
| chr17: 55087500-55087650 | COIL | 54.74 |
| chrX: 106361980-106362130 | RBM41 | 57.66 |
| chrX: 106361980-106362130 | NUP62CL | 57.66 |
| chr8: 101839300-101839450 | YWHAZ | 59.61 |
| chr10: 70982140-70982290 | SUPV3L1 | 63.52 |
| chr14: 20999220-20999370 | APEX1 | 65.63 |
| chr19: 9190580-9190730 | ZNF317 | 66.44 |