SOM cluster: 28
Cluster Hypersensitivity Profile

Genomic Location Trend
These plots show the distribution of the DHS sites surrounding the Transcript Start Site of the nearest gene.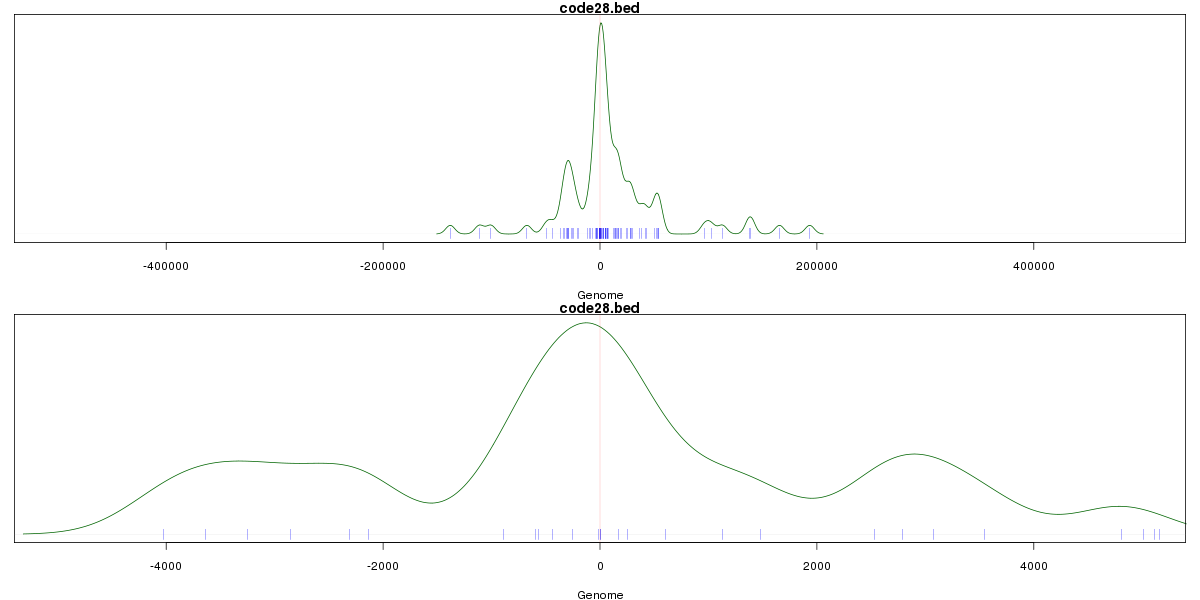
Stats
Number of sites: 87Promoter: 9%
CpG-Island: 4%
Conserved: 47%
Enriched Motifs & Matches
Match Detail: [Jaspar]
|
| ||
|---|---|---|
| Sites: 59/87 | e-val: 9.80909e-45 | ||
| Factor | e-val(match) | DB |
| AP1 | 0.0000000016603 | JASPAR |
| NFE2L2 | 0.0000000071877 | JASPAR |
| NFE2L1::MafG | 0.00011942 | JASPAR |
| PBX1 | 0.01059 | JASPAR |
| Pax2 | 0.022026 | JASPAR |
|
| ||
| Sites: 36/87 | e-val: 0.000000019 | ||
| Factor | e-val(match) | DB |
| FEV | 0.0000000000071593 | JASPAR |
| SPI1 | 0.00000000032991 | JASPAR |
| GABPA | 0.0000000032591 | JASPAR |
| ELF5 | 0.00000015025 | JASPAR |
| Stat3 | 0.00000036165 | JASPAR |
BED file downloads
Top 10 Example Regions
| Location | Gene Link | Dist. |
|---|---|---|
| chr10: 14644080-14644230 | FAM107B | 47.7 |
| chr4: 87899020-87899170 | AFF1 | 60.84 |
| chr5: 108083440-108083590 | FER | 61.22 |
| chr7: 100143320-100143470 | PCOLCE | 65.85 |
| chr6: 31171740-31171890 | POU5F1 | 66.23 |
| chr12: 50926720-50926870 | DIP2B | 66.49 |
| chr20: 48392960-48393110 | B4GALT5 | 71.92 |
| chr8: 81260220-81260370 | RP11-941H19.1 | 72.76 |
| chr1: 15744100-15744250 | FHAD1 | 73.3 |
| chr1: 15744100-15744250 | EFHD2 | 73.3 |