SOM cluster: 270
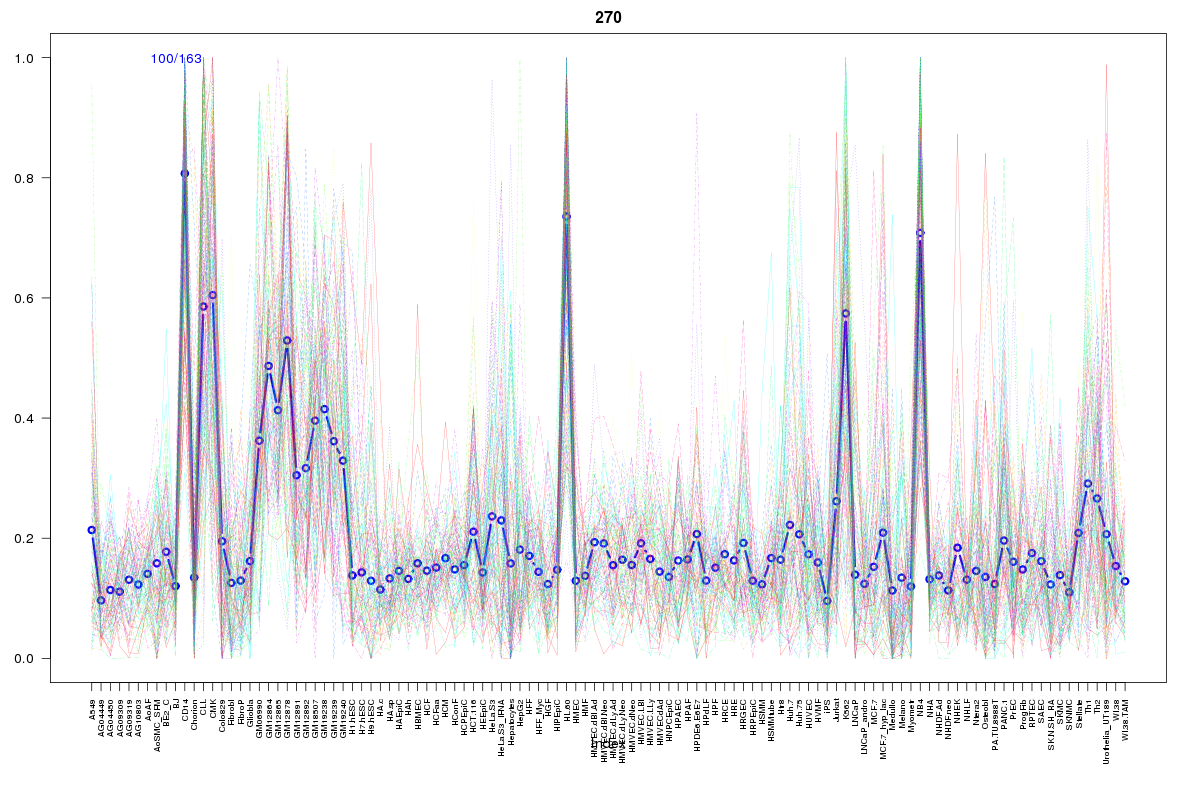
Cluster Hypersensitivity Profile

Genomic Location Trend
These plots show the distribution of the DHS sites surrounding the Transcript Start Site of the nearest gene.
Stats
Number of sites: 163Promoter: 31%
CpG-Island: 12%
Conserved: 32%
Enriched Motifs & Matches
Match Detail: [Jaspar]
|
| ||
|---|---|---|
| Sites: 68/100 | e-val: 0 | ||
| Factor | e-val(match) | DB |
| SPIB | 0.0000002106 | JASPAR |
| SPI1 | 0.000016083 | JASPAR |
| IRF1 | 0.0037881 | JASPAR |
| FEV | 0.003946 | JASPAR |
| Stat3 | 0.0041777 | JASPAR |
BED file downloads
Top 10 Example Regions
| Location | Gene Link | Dist. |
|---|---|---|
| chr1: 149856520-149856670 | MTMR11 | 20.79 |
| chr1: 149856520-149856670 | HIST2H2AB | 20.79 |
| chr1: 149856520-149856670 | HIST2H2BE | 20.79 |
| chr1: 161708500-161708650 | FCRLB | 37.8 |
| chr12: 49412880-49413030 | PRKAG1 | 41.42 |
| chr17: 76745025-76745175 | RNU6-638P | 48.02 |
| chr17: 76745025-76745175 | CYTH1 | 48.02 |
| chr19: 51942300-51942450 | NKG7 | 53.62 |
| chr19: 51942300-51942450 | SIGLEC6 | 53.62 |
| chr19: 51942300-51942450 | SIGLEC10 | 53.62 |