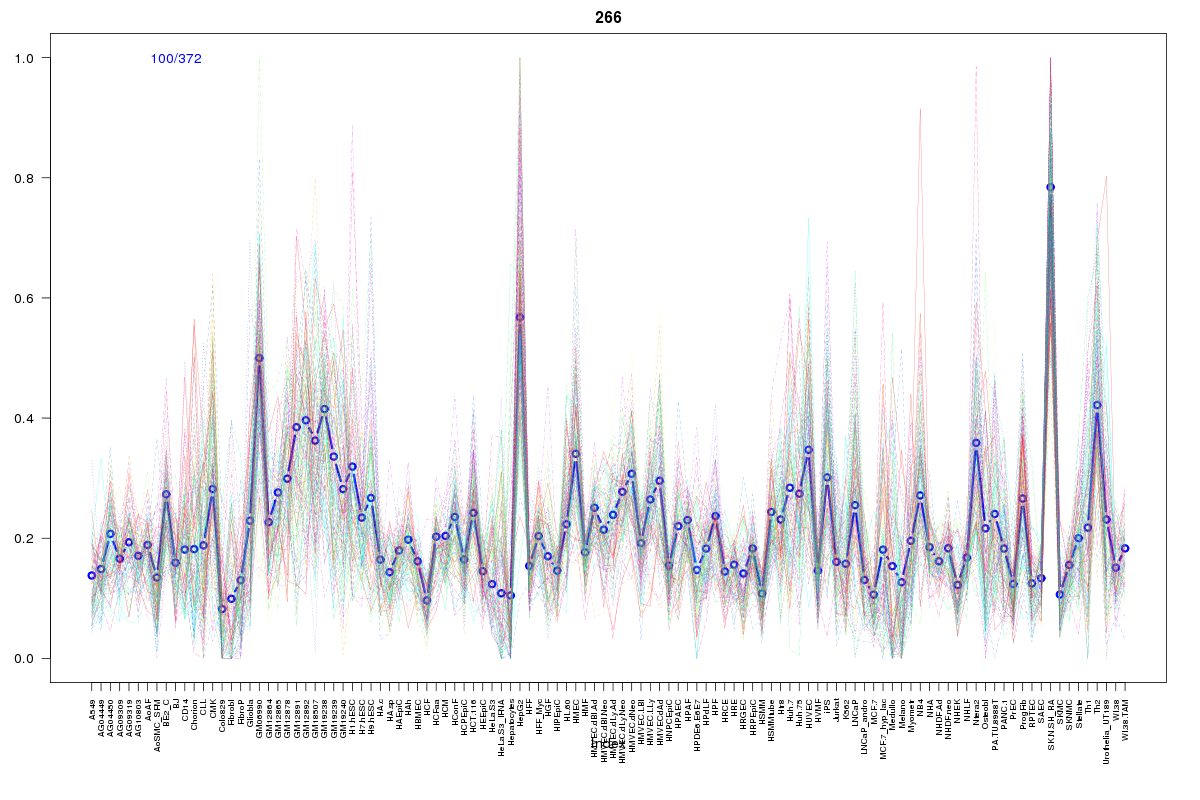
SOM cluster: 266
Cluster Hypersensitivity Profile

Genomic Location Trend
These plots show the distribution of the DHS sites surrounding the Transcript Start Site of the nearest gene.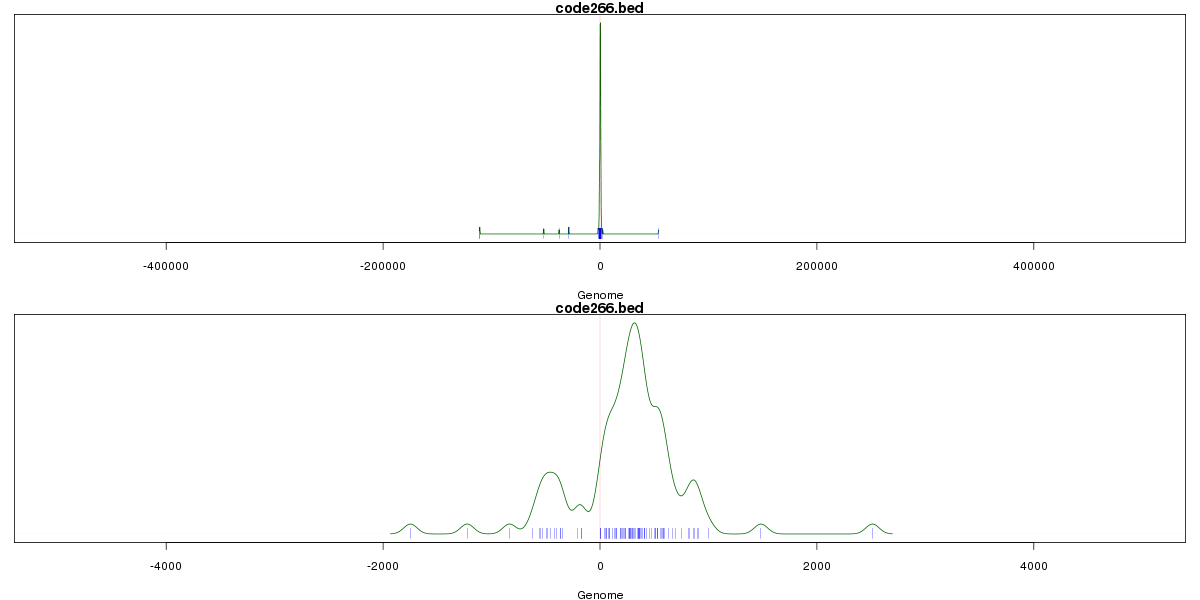
Stats
Number of sites: 372Promoter: 27%
CpG-Island: 96%
Conserved: 68%
Enriched Motifs & Matches
Match Detail: [Jaspar]
|
| ||
|---|---|---|
| Sites: 94/100 | e-val: 0 | ||
| Factor | e-val(match) | DB |
| SP1 | 0.000031548 | JASPAR |
| TFAP2A | 0.00093687 | JASPAR |
| Egr1 | 0.020492 | JASPAR |
| Zfx | 0.037268 | JASPAR |
| PLAG1 | 0.058651 | JASPAR |
|
| ||
| Sites: 99/100 | e-val: 0 | ||
| Factor | e-val(match) | DB |
| SP1 | 0.00000016474 | JASPAR |
| TFAP2A | 0.00036791 | JASPAR |
| PLAG1 | 0.00057453 | JASPAR |
| INSM1 | 0.054289 | JASPAR |
| Klf4 | 0.098178 | JASPAR |
|
| ||
| Sites: 66/100 | e-val: 0.0000000000000073 | ||
| Factor | e-val(match) | DB |
| SP1 | 0.0000028753 | JASPAR |
| TFAP2A | 0.0019954 | JASPAR |
| PLAG1 | 0.0041549 | JASPAR |
| Egr1 | 0.018877 | JASPAR |
| Myf | 0.049451 | JASPAR |
BED file downloads
Top 10 Example Regions
| Location | Gene Link | Dist. |
|---|---|---|
| chr5: 87971560-87971710 | LINC00461 | 46.24 |
| chr5: 87971560-87971710 | CTC-470C15.1 | 46.24 |
| chr12: 93965660-93965810 | SOCS2 | 46.73 |
| chr12: 93965660-93965810 | SOCS2-AS1 | 46.73 |
| chr9: 17135440-17135590 | CNTLN | 51 |
| chr1: 91870165-91870315 | FEN1P1 | 55.32 |
| chr7: 148396780-148396930 | C7orf33 | 59.44 |
| chr8: 61592540-61592690 | CHD7 | 63.46 |
| chr8: 61592540-61592690 | RAB2A | 63.46 |
| chr6: 32095560-32095710 | C4B-AS1 | 63.76 |