SOM cluster: 262
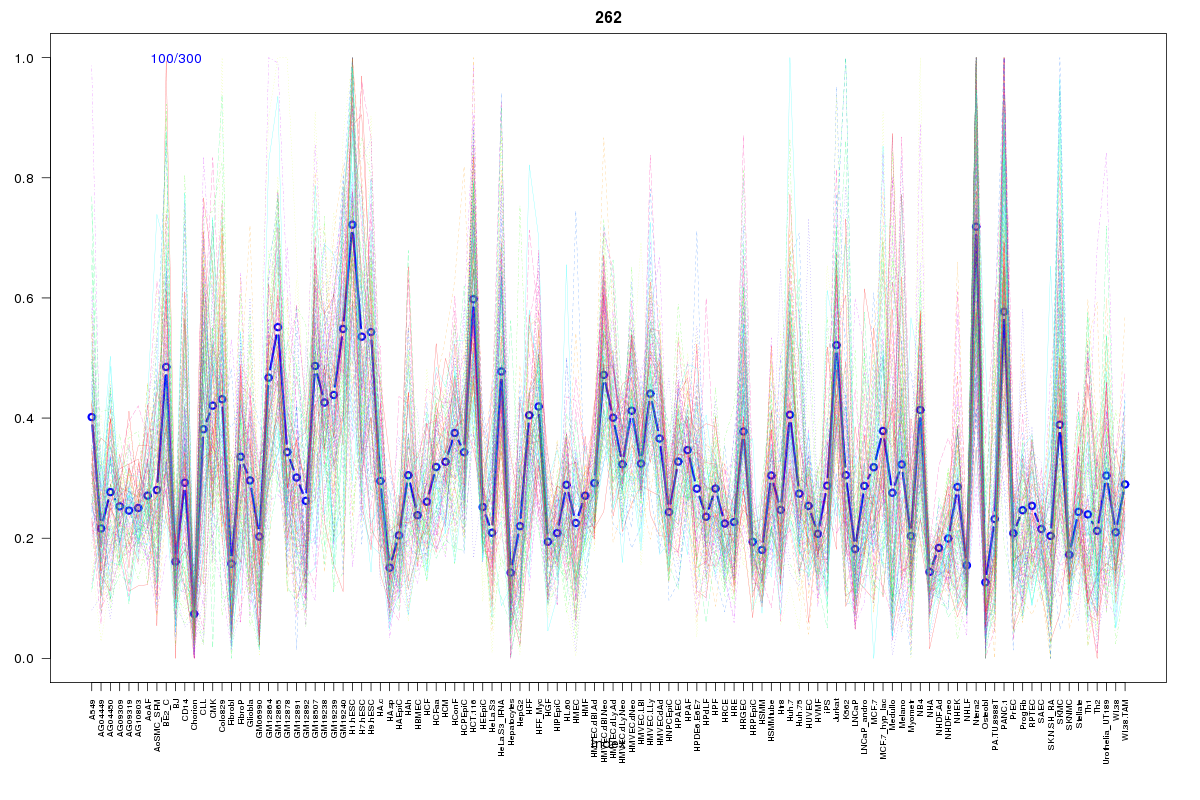
Cluster Hypersensitivity Profile

Genomic Location Trend
These plots show the distribution of the DHS sites surrounding the Transcript Start Site of the nearest gene.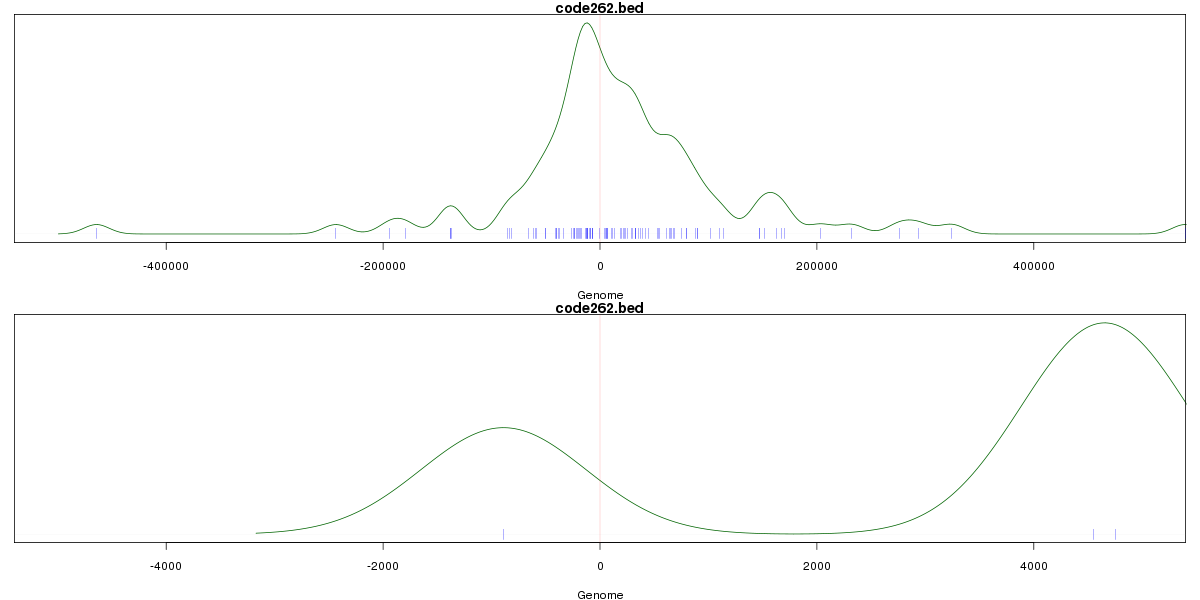
Stats
Number of sites: 300Promoter: 1%
CpG-Island: 0%
Conserved: 53%
Enriched Motifs & Matches
Match Detail: [Jaspar]
|
| ||
|---|---|---|
| Sites: 83/100 | e-val: 0 | ||
| Factor | e-val(match) | DB |
| CTCF | 0 | JASPAR |
| INSM1 | 0.000046582 | JASPAR |
| SP1 | 0.012133 | JASPAR |
| Zfp423 | 0.01255 | JASPAR |
| PLAG1 | 0.021491 | JASPAR |
BED file downloads
Top 10 Example Regions
| Location | Gene Link | Dist. |
|---|---|---|
| chr7: 129882480-129882630 | snoU13 | 38.32 |
| chr7: 129882480-129882630 | TMEM209 | 38.32 |
| chr19: 20070100-20070250 | ZNF93 | 39.56 |
| chr19: 20070100-20070250 | ZNF682 | 39.56 |
| chr19: 20070100-20070250 | ZNF253 | 39.56 |
| chr3: 39106780-39106930 | WDR48 | 42.64 |
| chr1: 44784105-44784255 | ERI3-IT1 | 43.25 |
| chr17: 10517940-10518090 | MYH2 | 45.81 |
| chr1: 49283320-49283470 | BEND5 | 53.28 |
| chr12: 108587705-108587855 | RP11-1K3.1 | 56.66 |