SOM cluster: 261
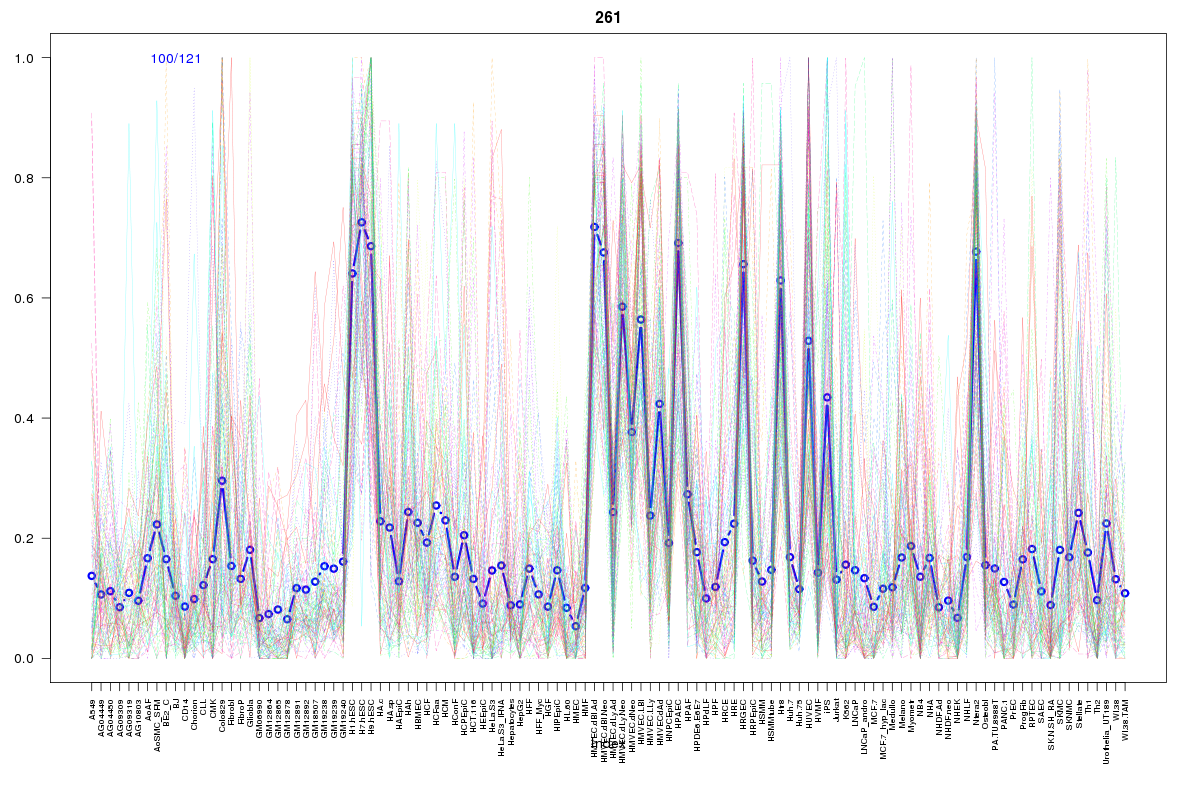
Cluster Hypersensitivity Profile

Genomic Location Trend
These plots show the distribution of the DHS sites surrounding the Transcript Start Site of the nearest gene.
Stats
Number of sites: 121Promoter: 5%
CpG-Island: 3%
Conserved: 48%
Enriched Motifs & Matches
Match Detail: [Jaspar]
|
| ||
|---|---|---|
| Sites: 42/100 | e-val: 0.0000000078 | ||
| Factor | e-val(match) | DB |
| EWSR1-FLI1 | 0.00000011086 | JASPAR |
| FEV | 0.00000041955 | JASPAR |
| SPI1 | 0.0000018093 | JASPAR |
| Stat3 | 0.000013901 | JASPAR |
| SPIB | 0.000078243 | JASPAR |
|
| ||
| Sites: 15/100 | e-val: 0.35 | ||
| Factor | e-val(match) | DB |
| SP1 | 0.00000000025696 | JASPAR |
| Pax4 | 0.000000083026 | JASPAR |
| RREB1 | 0.00000032792 | JASPAR |
| EWSR1-FLI1 | 0.000010573 | JASPAR |
| Klf4 | 0.0015135 | JASPAR |
|
| ||
| Sites: 23/100 | e-val: 0.19 | ||
| Factor | e-val(match) | DB |
| SOX9 | 0.000000053838 | JASPAR |
| SOX10 | 0.00000019301 | JASPAR |
| Sox2 | 0.00000019384 | JASPAR |
| SRY | 0.000015542 | JASPAR |
| Pou5f1 | 0.000082388 | JASPAR |
BED file downloads
Top 10 Example Regions
| Location | Gene Link | Dist. |
|---|---|---|
| chr13: 99159500-99159650 | FARP1-AS1 | 43.87 |
| chr17: 15869840-15869990 | TTC19 | 52.35 |
| chr3: 177062940-177063090 | LINC00501 | 61.75 |
| chr12: 32607920-32608070 | FGD4 | 64.36 |
| chr3: 23907600-23907750 | UBE2E1 | 70.17 |
| chr12: 110384400-110384550 | TCHP | 70.73 |
| chr12: 110384400-110384550 | RP1-7G5.6 | 70.73 |
| chr3: 30708760-30708910 | AC096921.2 | 72.22 |
| chr22: 28246280-28246430 | PITPNB | 74.65 |
| chr12: 89739640-89739790 | POC1B | 76.08 |