SOM cluster: 2494
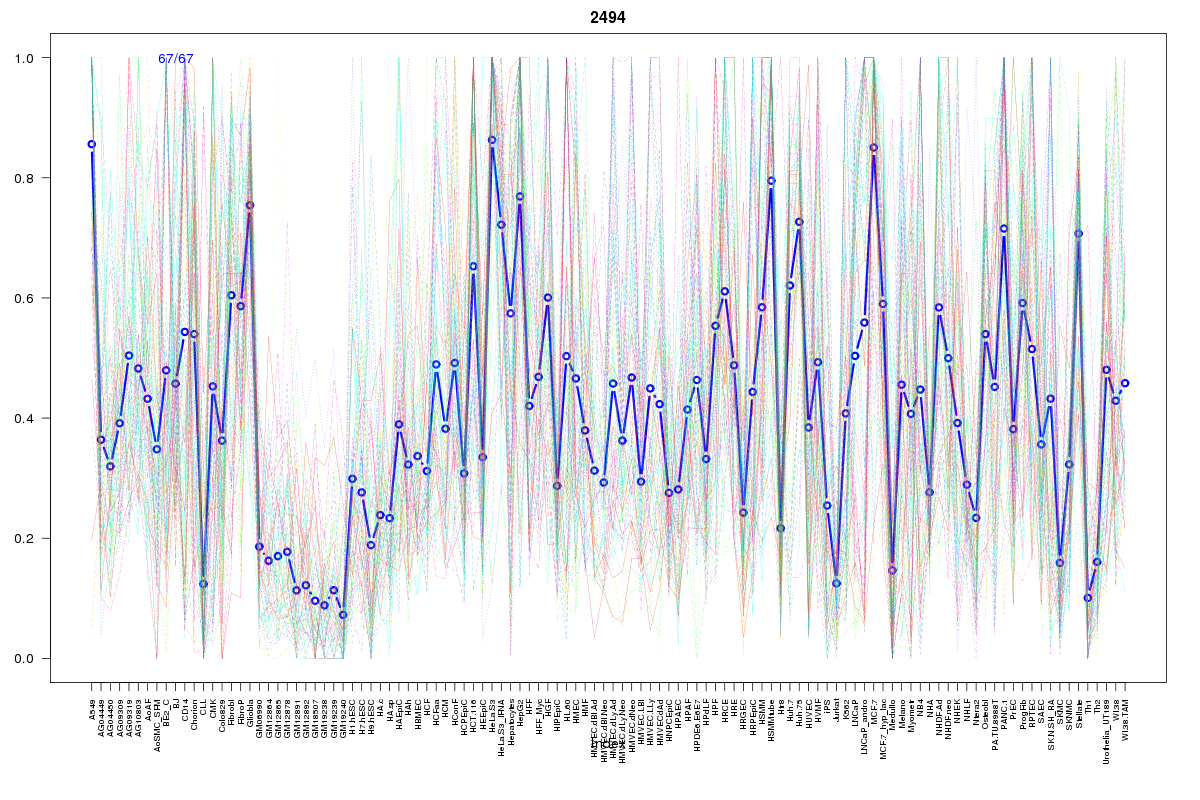
Cluster Hypersensitivity Profile

Genomic Location Trend
These plots show the distribution of the DHS sites surrounding the Transcript Start Site of the nearest gene.
Stats
Number of sites: 67Promoter: 10%
CpG-Island: 7%
Conserved: 31%
Enriched Motifs & Matches
Match Detail: [Jaspar]
|
| ||
|---|---|---|
| Sites: 56/67 | e-val: 0.000000000052 | ||
| Factor | e-val(match) | DB |
| Stat3 | 0.0029377 | JASPAR |
| Myf | 0.014299 | JASPAR |
| EBF1 | 0.024916 | JASPAR |
| TP53 | 0.036785 | JASPAR |
| FEV | 0.038548 | JASPAR |
|
| ||
| Sites: 19/67 | e-val: 0.000000099 | ||
| Factor | e-val(match) | DB |
| SP1 | 0.000064012 | JASPAR |
| Klf4 | 0.0024275 | JASPAR |
| SPI1 | 0.0031986 | JASPAR |
| Tal1::Gata1 | 0.0061431 | JASPAR |
| INSM1 | 0.0084682 | JASPAR |
|
| ||
| Sites: 29/67 | e-val: 0.007 | ||
| Factor | e-val(match) | DB |
| NFE2L2 | 0.00031827 | JASPAR |
| ESR1 | 0.00077239 | JASPAR |
| Mafb | 0.0037347 | JASPAR |
| T | 0.01413 | JASPAR |
| ESR2 | 0.019135 | JASPAR |