SOM cluster: 2491
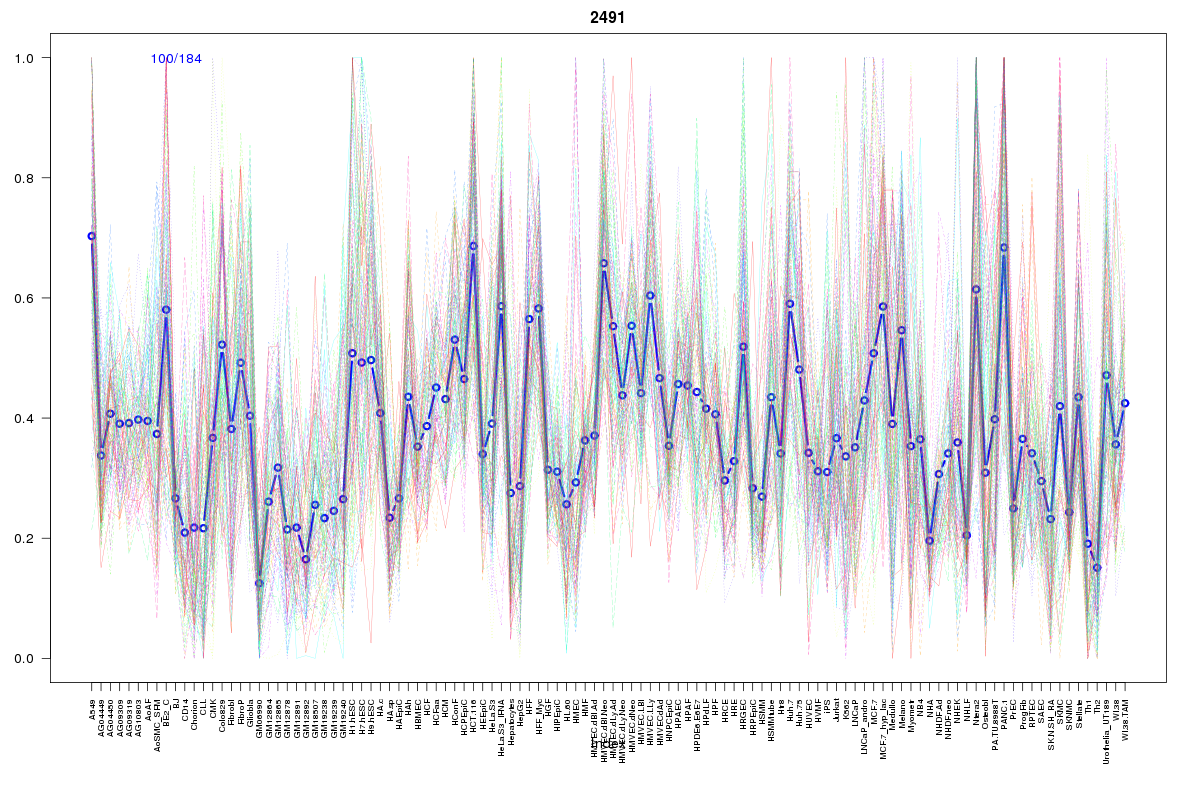
Cluster Hypersensitivity Profile

Genomic Location Trend
These plots show the distribution of the DHS sites surrounding the Transcript Start Site of the nearest gene.
Stats
Number of sites: 184Promoter: 3%
CpG-Island: 0%
Conserved: 63%
Enriched Motifs & Matches
Match Detail: [Jaspar]
|
| ||
|---|---|---|
| Sites: 74/100 | e-val: 0 | ||
| Factor | e-val(match) | DB |
| CTCF | 0.0000000000017595 | JASPAR |
| INSM1 | 0.00016903 | JASPAR |
| Zfp423 | 0.0096802 | JASPAR |
| TAL1::TCF3 | 0.034284 | JASPAR |
| PLAG1 | 0.04393 | JASPAR |
BED file downloads
Top 10 Example Regions
| Location | Gene Link | Dist. |
|---|---|---|
| chr11: 18824220-18824370 | RP11-1081L13.3 | 50.73 |
| chr11: 18824220-18824370 | RP11-583F24.6 | 50.73 |
| chr8: 120429100-120429250 | NOV | 54.28 |
| chr17: 64670100-64670250 | PRKCA | 55.78 |
| chr17: 64670100-64670250 | AC006947.1 | 55.78 |
| chr21: 42505940-42506090 | LINC00323 | 58.31 |
| chr21: 42505940-42506090 | BACE2 | 58.31 |
| chr2: 30462180-30462330 | AC104698.2 | 58.98 |
| chr1: 8035540-8035690 | ERRFI1 | 62.06 |
| chr7: 37956760-37956910 | SFRP4 | 62.81 |