SOM cluster: 2483
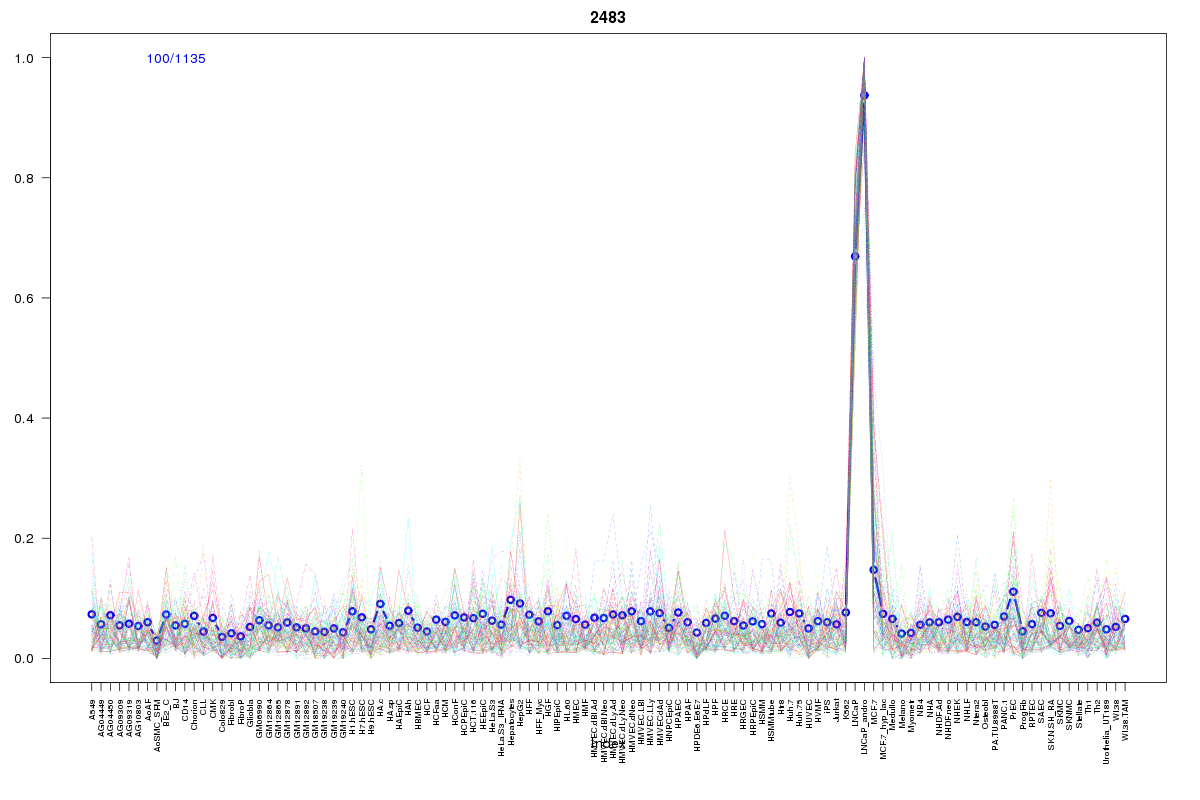
Cluster Hypersensitivity Profile

Genomic Location Trend
These plots show the distribution of the DHS sites surrounding the Transcript Start Site of the nearest gene.
Stats
Number of sites: 1135Promoter: 1%
CpG-Island: 1%
Conserved: 36%
Enriched Motifs & Matches
Match Detail: [Jaspar]
|
| ||
|---|---|---|
| Sites: 14/100 | e-val: 0.059 | ||
| Factor | e-val(match) | DB |
| HNF4A | 0.000067287 | JASPAR |
| PPARG::RXRA | 0.00072956 | JASPAR |
| TLX1::NFIC | 0.0032711 | JASPAR |
| NR2F1 | 0.010431 | JASPAR |
| Stat3 | 0.020663 | JASPAR |
|
| ||
| Sites: 26/100 | e-val: 1.8 | ||
| Factor | e-val(match) | DB |
| FOXA1 | 0.000000000000017208 | JASPAR |
| Foxa2 | 0.000000000000020761 | JASPAR |
| FOXI1 | 0.00000012944 | JASPAR |
| FOXF2 | 0.00000017903 | JASPAR |
| Foxd3 | 0.00000026129 | JASPAR |
BED file downloads
Top 10 Example Regions
| Location | Gene Link | Dist. |
|---|---|---|
| chr12: 49448980-49449130 | WNT10B | 48.33 |
| chr19: 54979040-54979190 | LENG9 | 48.68 |
| chr3: 128038800-128038950 | EEFSEC | 49.54 |
| chr3: 53875400-53875550 | CHDH | 52.73 |
| chr21: 42878525-42878675 | TMPRSS2 | 53.88 |
| chr22: 24990260-24990410 | FAM211B | 54.18 |
| chr3: 16278720-16278870 | DPH3 | 58.68 |
| chr11: 75188140-75188290 | KLHL35 | 59.85 |
| chr6: 3244580-3244730 | BPHL | 62.51 |
| chr6: 3244580-3244730 | TUBB2BP1 | 62.51 |