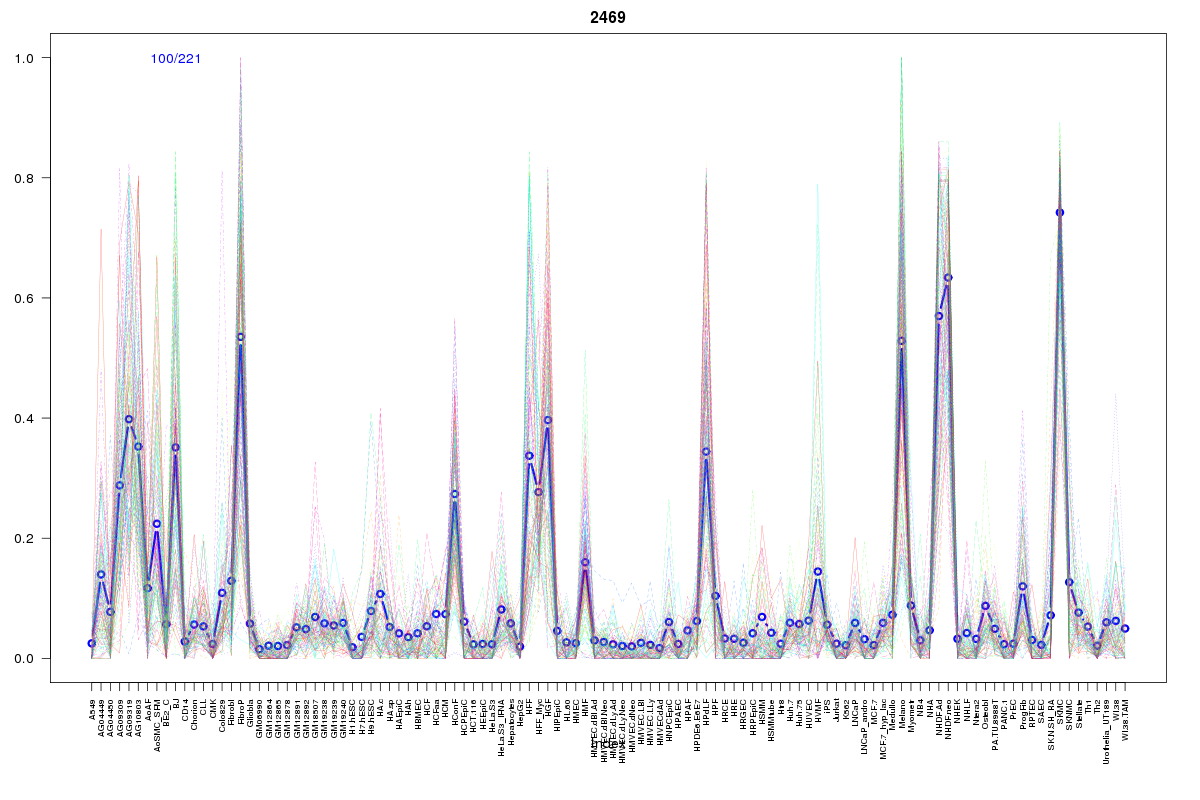
SOM cluster: 2469
Cluster Hypersensitivity Profile

Genomic Location Trend
These plots show the distribution of the DHS sites surrounding the Transcript Start Site of the nearest gene.
Stats
Number of sites: 221Promoter: 0%
CpG-Island: 0%
Conserved: 64%
Enriched Motifs & Matches
Match Detail: [Jaspar]
|
| ||
|---|---|---|
| Sites: 71/100 | e-val: 0 | ||
| Factor | e-val(match) | DB |
| TAL1::TCF3 | 0.00000075341 | JASPAR |
| Prrx2 | 0.00007466 | JASPAR |
| ARID3A | 0.00029194 | JASPAR |
| Nobox | 0.0014728 | JASPAR |
| Pdx1 | 0.0018361 | JASPAR |
|
| ||
| Sites: 30/100 | e-val: 0.0000024 | ||
| Factor | e-val(match) | DB |
| Lhx3 | 0.000051993 | JASPAR |
| HNF1B | 0.00005742 | JASPAR |
| ARID3A | 0.00091415 | JASPAR |
| HNF1A | 0.0010191 | JASPAR |
| Foxd3 | 0.0017844 | JASPAR |
BED file downloads
Top 10 Example Regions
| Location | Gene Link | Dist. |
|---|---|---|
| chr8: 37636840-37636990 | RP11-863K10.2 | 47.18 |
| chr8: 37636840-37636990 | GPR124 | 47.18 |
| chr9: 132412420-132412570 | PRRX2 | 58.51 |
| chr4: 154295760-154295910 | TRIM2 | 58.66 |
| chr1: 171233180-171233330 | FMO4 | 60.62 |
| chr1: 92150140-92150290 | TGFBR3 | 66.39 |
| chrX: 112077820-112077970 | AMOT | 67.14 |
| chr12: 104917900-104918050 | CHST11 | 73.34 |
| chr8: 99112480-99112630 | MATN2 | 76.96 |
| chr1: 63190260-63190410 | RP5-849H19.2 | 78.9 |