SOM cluster: 2463
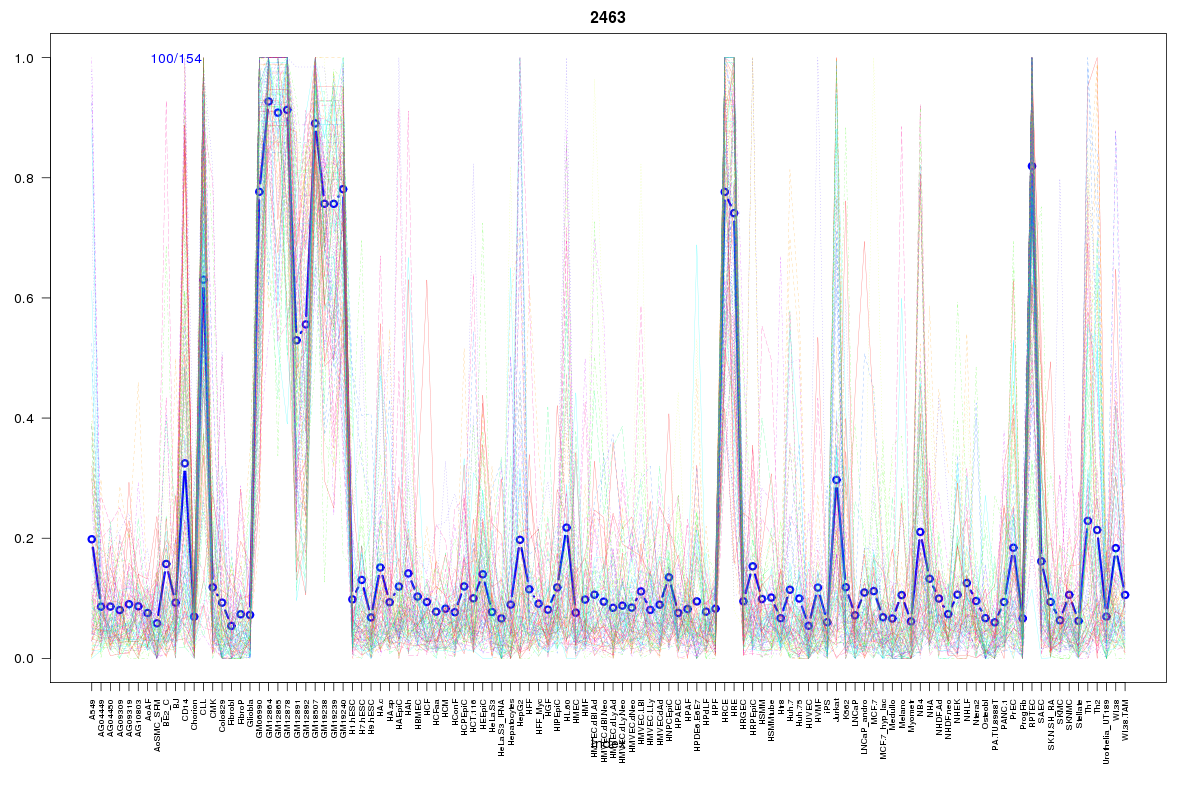
Cluster Hypersensitivity Profile

Genomic Location Trend
These plots show the distribution of the DHS sites surrounding the Transcript Start Site of the nearest gene.
Stats
Number of sites: 154Promoter: 5%
CpG-Island: 0%
Conserved: 33%
Enriched Motifs & Matches
Match Detail: [Jaspar]
|
| ||
|---|---|---|
| Sites: 23/100 | e-val: 0.014 | ||
| Factor | e-val(match) | DB |
| IRF1 | 0.000036132 | JASPAR |
| SPIB | 0.000037973 | JASPAR |
| SPI1 | 0.00019391 | JASPAR |
| FEV | 0.00019589 | JASPAR |
| IRF2 | 0.00096418 | JASPAR |
BED file downloads
Top 10 Example Regions
| Location | Gene Link | Dist. |
|---|---|---|
| chr1: 168994240-168994390 | ATP1B1 | 41.45 |
| chr12: 6536200-6536350 | VAMP1 | 43.22 |
| chr12: 6536200-6536350 | RP1-102E24.9 | 43.22 |
| chr12: 6536200-6536350 | TAPBPL | 43.22 |
| chr12: 6536200-6536350 | SCARNA10 | 43.22 |
| chr12: 6536200-6536350 | TNFRSF1A | 43.22 |
| chr12: 6536200-6536350 | CD27 | 43.22 |
| chr12: 6536200-6536350 | LTBR | 43.22 |
| chr12: 6536200-6536350 | CD27-AS1 | 43.22 |
| chr6: 305980-306130 | IRF4 | 49.36 |