SOM cluster: 2460
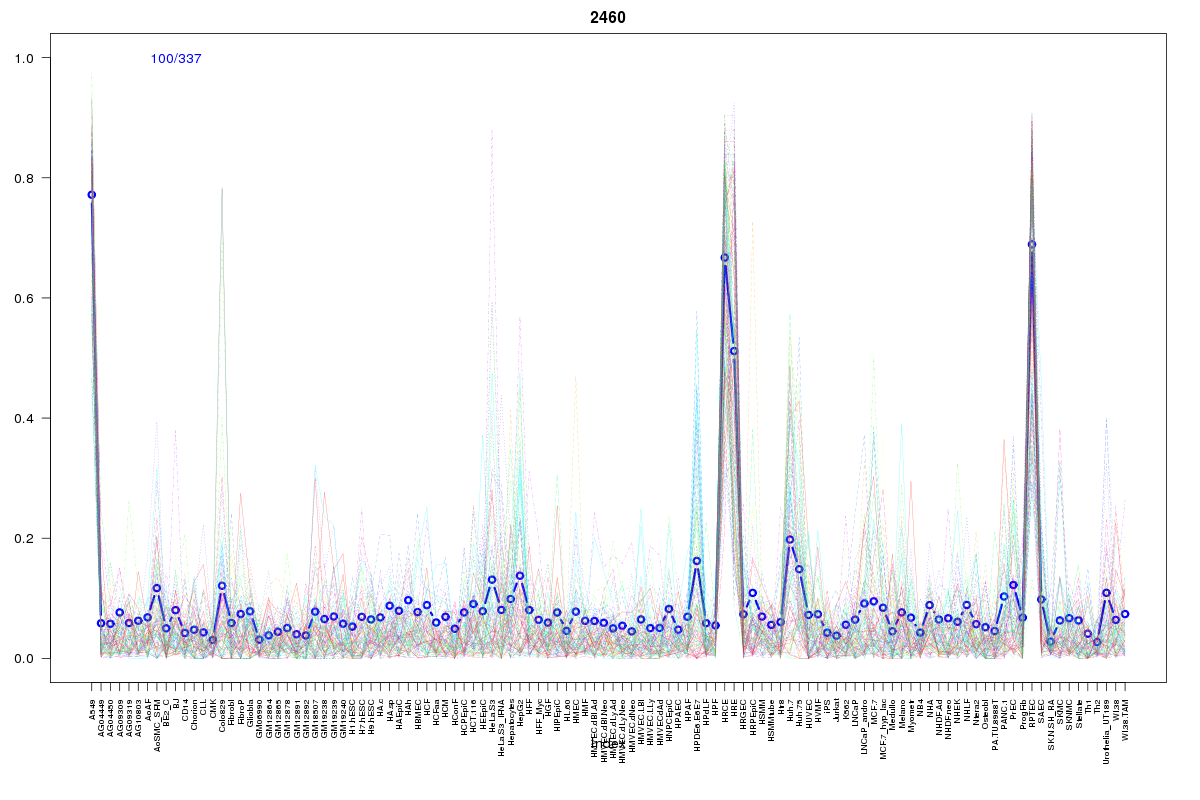
Cluster Hypersensitivity Profile

Genomic Location Trend
These plots show the distribution of the DHS sites surrounding the Transcript Start Site of the nearest gene.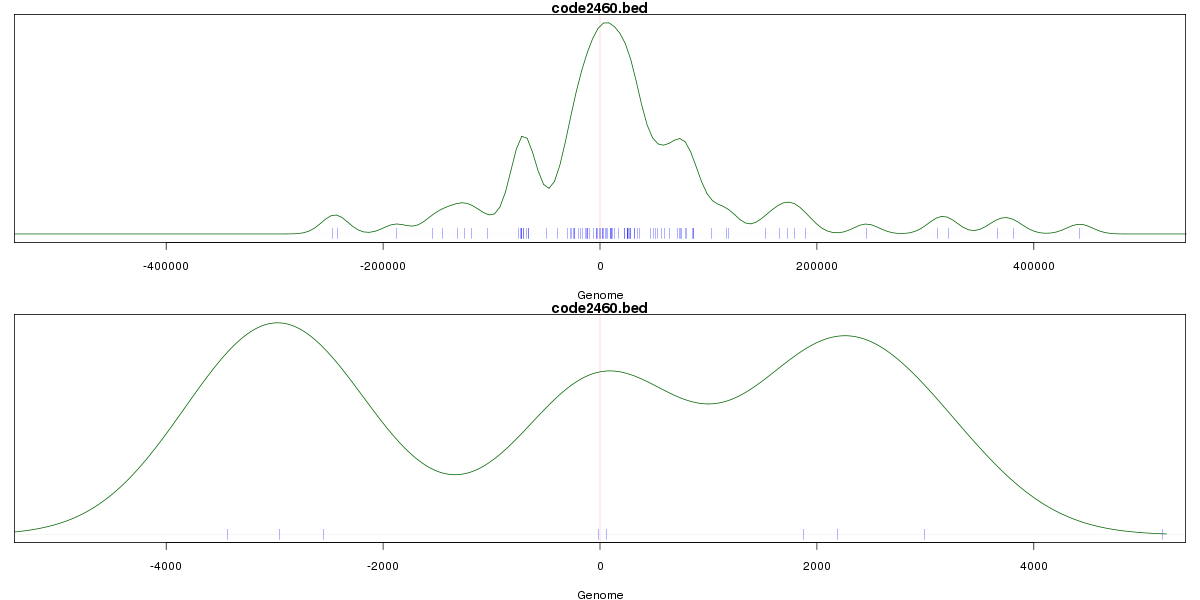
Stats
Number of sites: 337Promoter: 2%
CpG-Island: 0%
Conserved: 32%
Enriched Motifs & Matches
Match Detail: [Jaspar]
|
| ||
|---|---|---|
| Sites: 43/100 | e-val: 3.8e-30 | ||
| Factor | e-val(match) | DB |
| HNF1B | 0 | JASPAR |
| HNF1A | 0.0000000000000073275 | JASPAR |
| Lhx3 | 0.00000035368 | JASPAR |
| Prrx2 | 0.000060329 | JASPAR |
| NKX3-1 | 0.00041709 | JASPAR |
BED file downloads
Top 10 Example Regions
| Location | Gene Link | Dist. |
|---|---|---|
| chr3: 30366200-30366350 | U3 | 47.95 |
| chr10: 27523260-27523410 | ACBD5 | 50.3 |
| chr11: 63771820-63771970 | OTUB1 | 52.47 |
| chr17: 68071260-68071410 | KCNJ16 | 53.48 |
| chr12: 86230320-86230470 | RASSF9 | 54.55 |
| chr8: 8188000-8188150 | SGK223 | 55.31 |
| chr8: 98798360-98798510 | LAPTM4B | 57.55 |
| chr3: 177017760-177017910 | LINC00501 | 59.54 |
| chr4: 88896080-88896230 | SPP1 | 60.79 |
| chr1: 165614900-165615050 | MGST3 | 63.88 |