SOM cluster: 2432
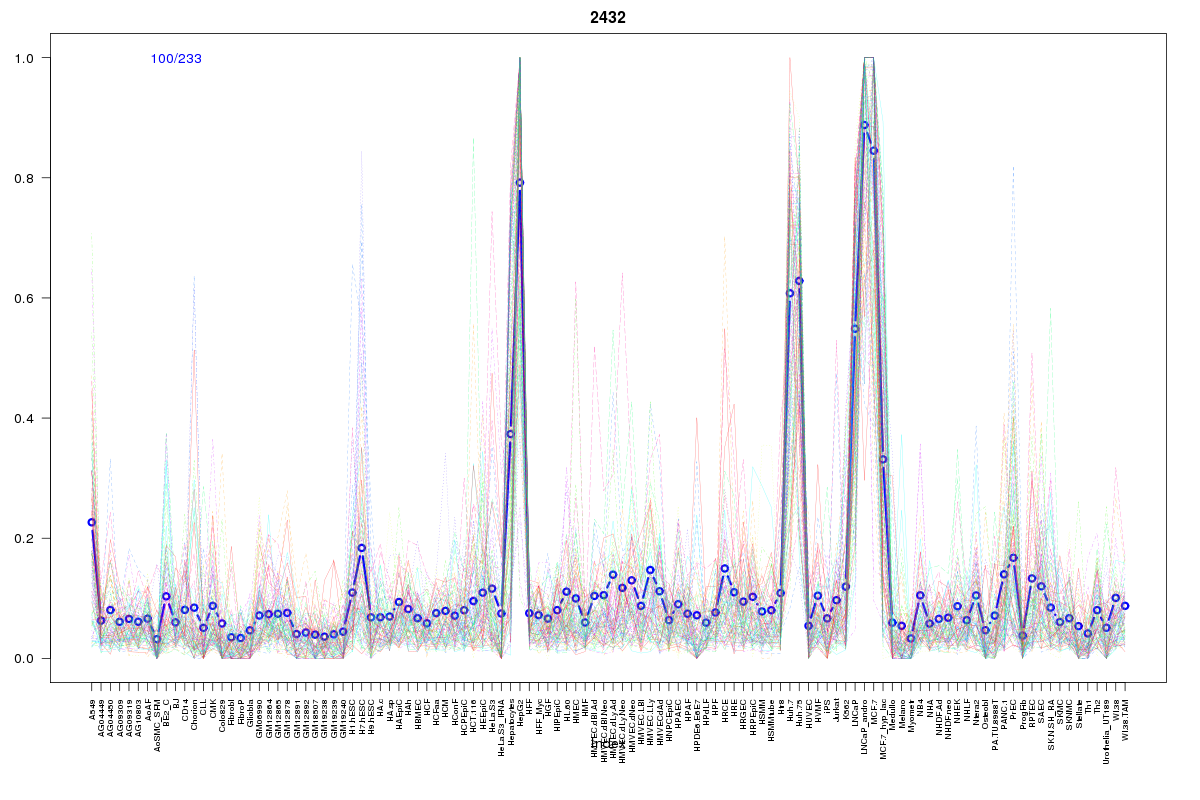
Cluster Hypersensitivity Profile

Genomic Location Trend
These plots show the distribution of the DHS sites surrounding the Transcript Start Site of the nearest gene.
Stats
Number of sites: 233Promoter: 7%
CpG-Island: 1%
Conserved: 46%
Enriched Motifs & Matches
Match Detail: [Jaspar]
|
| ||
|---|---|---|
| Sites: 56/100 | e-val: 5.5e-22 | ||
| Factor | e-val(match) | DB |
| FOXA1 | 0.00000000000011013 | JASPAR |
| Foxa2 | 0.0000000000057131 | JASPAR |
| FOXD1 | 0.0000011508 | JASPAR |
| FOXO3 | 0.0000016584 | JASPAR |
| Foxd3 | 0.00017499 | JASPAR |
BED file downloads
Top 10 Example Regions
| Location | Gene Link | Dist. |
|---|---|---|
| chr1: 149993500-149993650 | OTUD7B | 14.79 |
| chr10: 97148400-97148550 | SORBS1 | 51.47 |
| chr6: 41424620-41424770 | FOXP4 | 55.9 |
| chr14: 55823800-55823950 | RP11-665C16.6 | 57.52 |
| chr12: 102002300-102002450 | CHPT1 | 59.77 |
| chr16: 88826860-88827010 | TRAPPC2L | 60.28 |
| chr16: 88826860-88827010 | APRT | 60.28 |
| chr7: 36272640-36272790 | EEPD1 | 62.17 |
| chr1: 1060280-1060430 | RNF223 | 63.97 |
| chr22: 29616385-29616535 | RASL10A | 64.7 |