SOM cluster: 2414
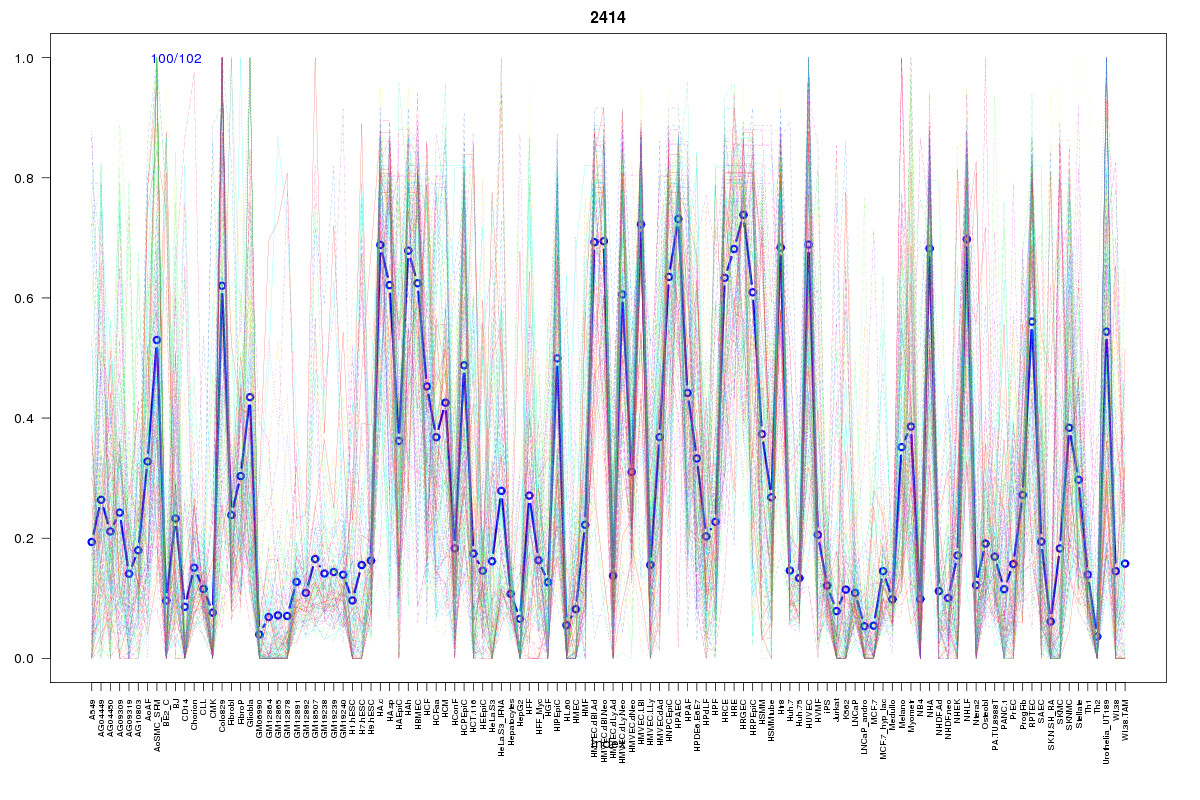
Cluster Hypersensitivity Profile

Genomic Location Trend
These plots show the distribution of the DHS sites surrounding the Transcript Start Site of the nearest gene.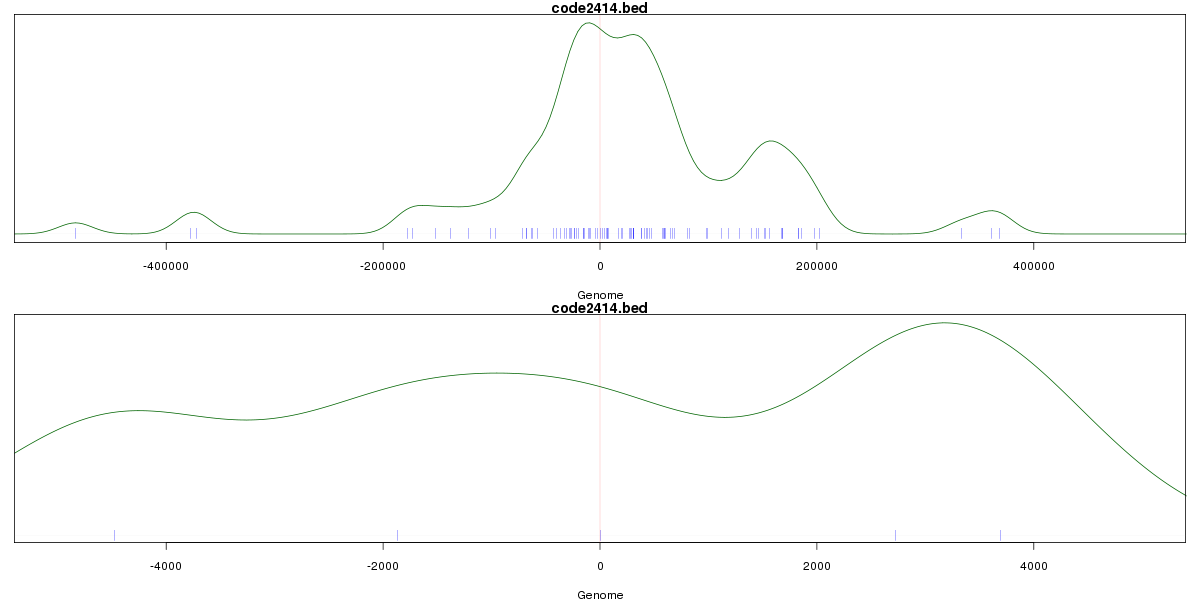
Stats
Number of sites: 102Promoter: 2%
CpG-Island: 0%
Conserved: 58%
Enriched Motifs & Matches
Match Detail: [Jaspar]
|
| ||
|---|---|---|
| Sites: 40/100 | e-val: 0.000016 | ||
| Factor | e-val(match) | DB |
| NFE2L2 | 0.00000000037127 | JASPAR |
| AP1 | 0.0000000024505 | JASPAR |
| NFE2L1::MafG | 0.00055269 | JASPAR |
| Pax2 | 0.0026501 | JASPAR |
| PBX1 | 0.0055659 | JASPAR |
BED file downloads
Top 10 Example Regions
| Location | Gene Link | Dist. |
|---|---|---|
| chr8: 103949800-103949950 | AZIN1 | 33.15 |
| chr17: 68106820-68106970 | KCNJ2 | 47.73 |
| chr11: 12824780-12824930 | TEAD1 | 49.07 |
| chr9: 72500620-72500770 | C9orf135-AS1 | 49.52 |
| chr9: 72500620-72500770 | RN7SL570P | 49.52 |
| chr13: 98908160-98908310 | FARP1 | 50.38 |
| chr5: 112395060-112395210 | MCC | 60.66 |
| chr12: 65824860-65825010 | MSRB3 | 61.92 |
| chr9: 14096640-14096790 | NFIB | 63.37 |
| chr2: 28632405-28632555 | FOSL2 | 64.46 |