SOM cluster: 2413
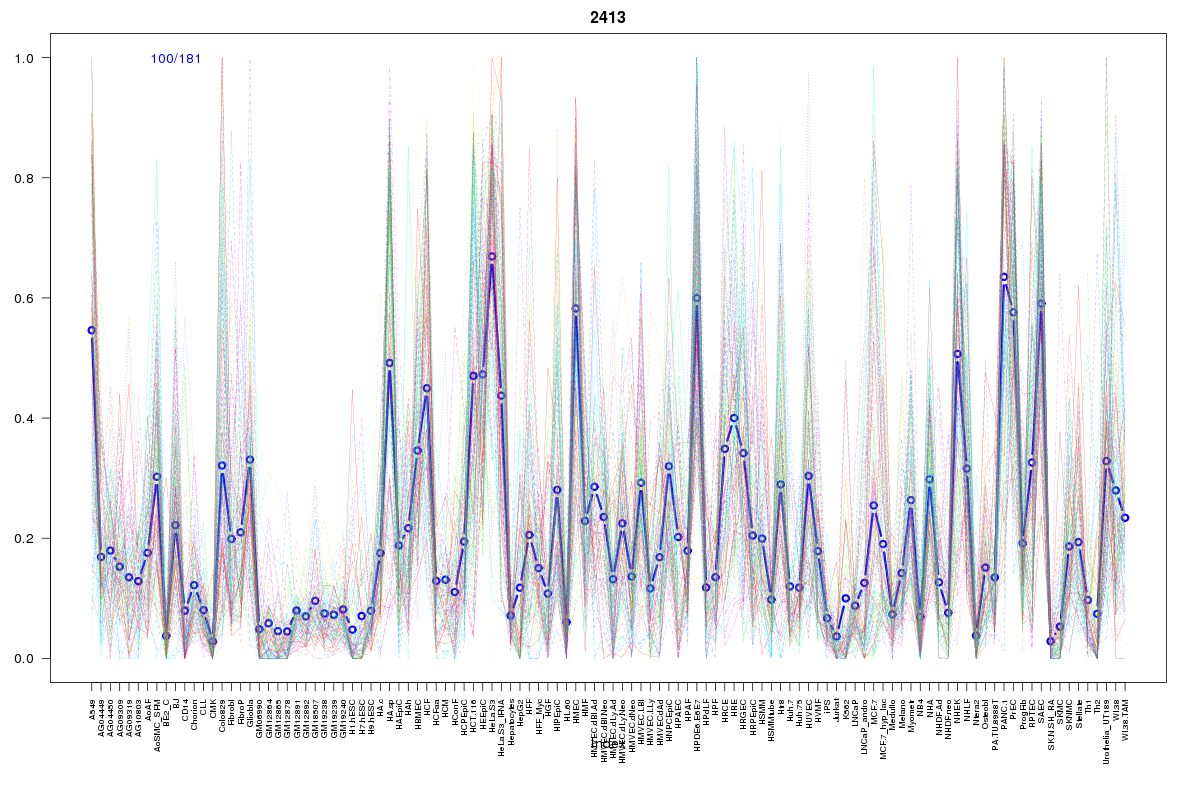
Cluster Hypersensitivity Profile

Genomic Location Trend
These plots show the distribution of the DHS sites surrounding the Transcript Start Site of the nearest gene.
Stats
Number of sites: 181Promoter: 1%
CpG-Island: 0%
Conserved: 38%
Enriched Motifs & Matches
Match Detail: [Jaspar]
|
| ||
|---|---|---|
| Sites: 45/100 | e-val: 7.1e-22 | ||
| Factor | e-val(match) | DB |
| AP1 | 0.00000013969 | JASPAR |
| NFE2L2 | 0.0000086209 | JASPAR |
| MEF2A | 0.00029972 | JASPAR |
| Lhx3 | 0.00044659 | JASPAR |
| NFE2L1::MafG | 0.0033173 | JASPAR |
BED file downloads
Top 10 Example Regions
| Location | Gene Link | Dist. |
|---|---|---|
| chr6: 41935120-41935270 | CCND3 | 35.66 |
| chrX: 118637020-118637310 | SLC25A43 | 50.72 |
| chrX: 118637020-118637310 | UBE2A | 50.72 |
| chr11: 85812660-85812810 | PICALM | 54.23 |
| chr17: 984380-984530 | TIMM22 | 57.43 |
| chr17: 984380-984530 | ABR | 57.43 |
| chr1: 16279040-16279190 | RP11-5P18.10 | 59.5 |
| chrX: 132860260-132860410 | GPC3 | 61.4 |
| chr7: 43625860-43626010 | STK17A | 61.57 |
| chr3: 150088260-150088410 | TSC22D2 | 62.37 |