SOM cluster: 2412
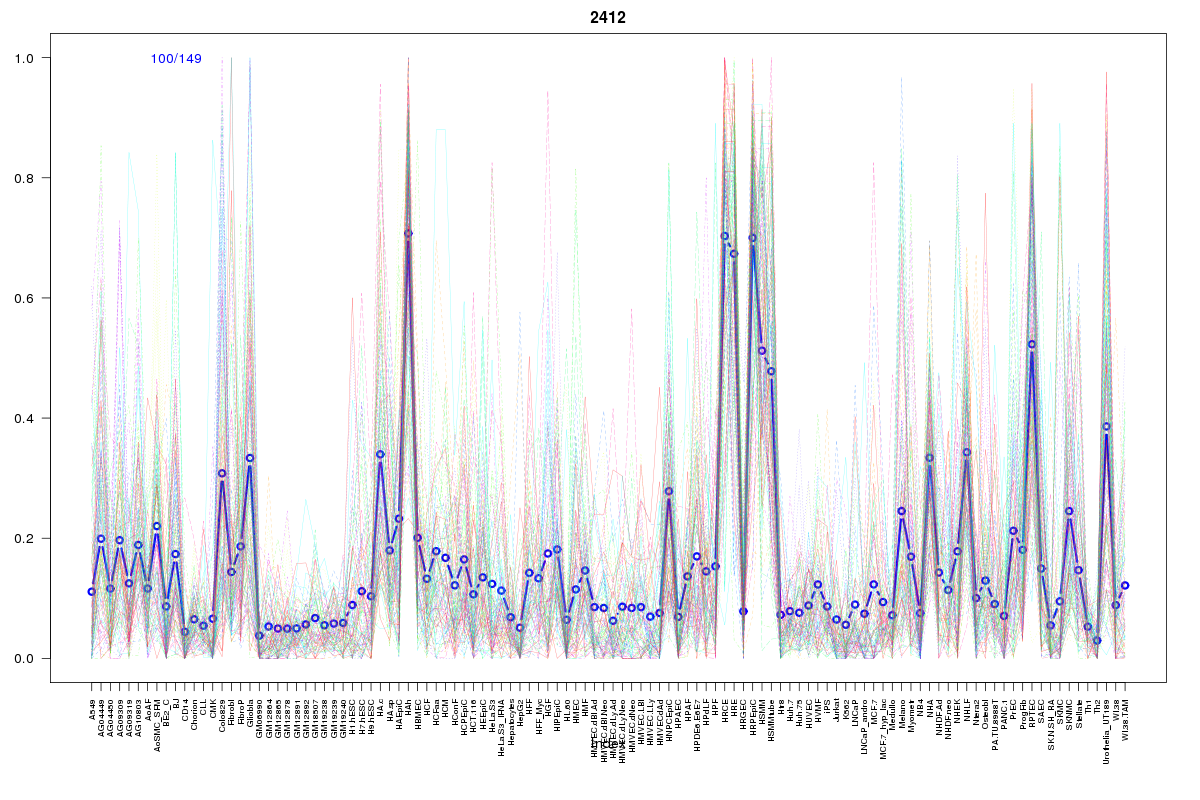
Cluster Hypersensitivity Profile

Genomic Location Trend
These plots show the distribution of the DHS sites surrounding the Transcript Start Site of the nearest gene.
Stats
Number of sites: 149Promoter: 1%
CpG-Island: 0%
Conserved: 47%
Enriched Motifs & Matches
Match Detail: [Jaspar]
|
| ||
|---|---|---|
| Sites: 21/100 | e-val: 0.0058 | ||
| Factor | e-val(match) | DB |
| AP1 | 0.000000000025742 | JASPAR |
| NFE2L2 | 0.0000000068398 | JASPAR |
| PPARG | 0.0025385 | JASPAR |
| NFE2L1::MafG | 0.0047519 | JASPAR |
| RORA_2 | 0.013255 | JASPAR |
BED file downloads
Top 10 Example Regions
| Location | Gene Link | Dist. |
|---|---|---|
| chr1: 171623700-171623850 | PFN1P1 | 42.07 |
| chr7: 39544700-39544850 | POU6F2-AS1 | 45.66 |
| chr11: 85862640-85862790 | FNTAL1 | 49.11 |
| chr11: 85862640-85862790 | PICALM | 49.11 |
| chr7: 43921960-43922110 | TUBG1P | 53.71 |
| chr3: 139464820-139464970 | NMNAT3 | 54.25 |
| chr18: 67990280-67990430 | SOCS6 | 54.56 |
| chr2: 75798120-75798270 | AC007099.1 | 56.25 |
| chr2: 75798120-75798270 | EVA1A | 56.25 |
| chr3: 139963920-139964070 | CLSTN2 | 64.37 |