SOM cluster: 240
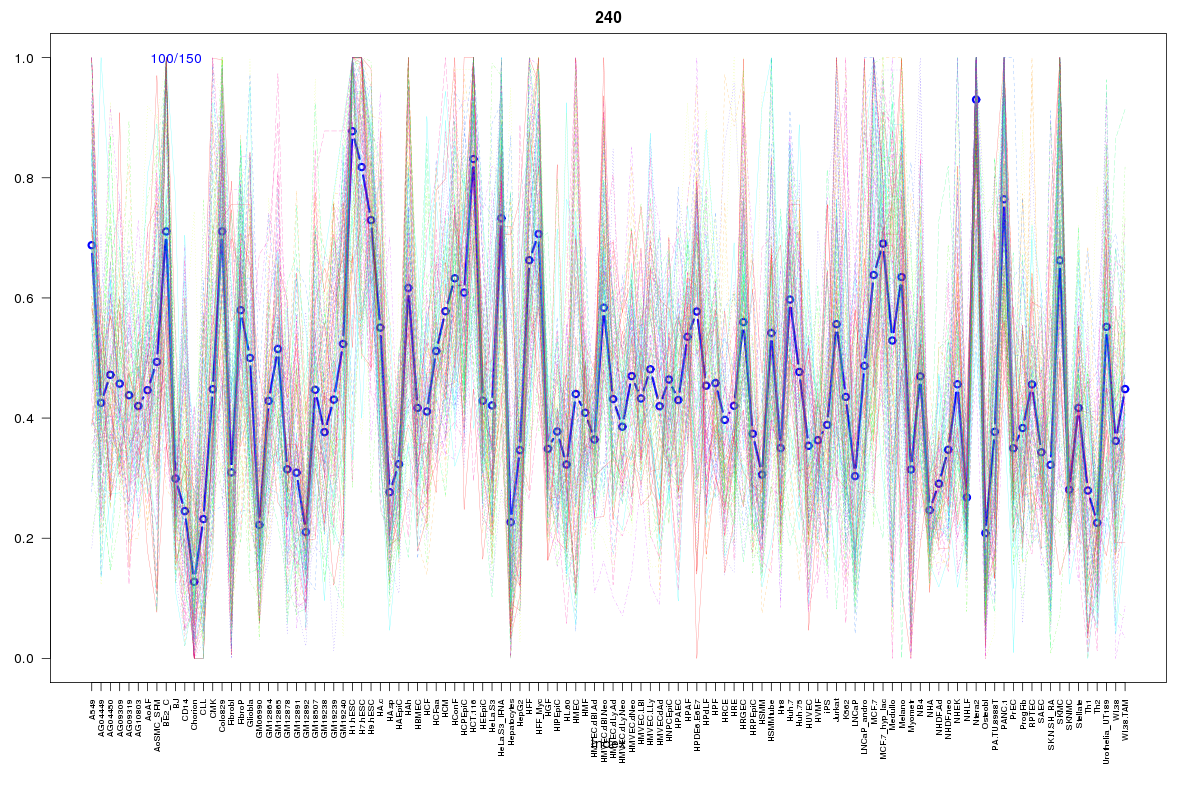
Cluster Hypersensitivity Profile

Genomic Location Trend
These plots show the distribution of the DHS sites surrounding the Transcript Start Site of the nearest gene.
Stats
Number of sites: 150Promoter: 3%
CpG-Island: 0%
Conserved: 74%
Enriched Motifs & Matches
Match Detail: [Jaspar]
|
| ||
|---|---|---|
| Sites: 71/100 | e-val: 0 | ||
| Factor | e-val(match) | DB |
| CTCF | 0 | JASPAR |
| INSM1 | 0.000085369 | JASPAR |
| SP1 | 0.0068001 | JASPAR |
| E2F1 | 0.013983 | JASPAR |
| TLX1::NFIC | 0.017285 | JASPAR |
BED file downloads
Top 10 Example Regions
| Location | Gene Link | Dist. |
|---|---|---|
| chr1: 150228380-150228530 | PRPF3 | 13.05 |
| chr1: 150228380-150228530 | MRPS21 | 13.05 |
| chr9: 110184640-110184790 | RAD23B | 23.68 |
| chr9: 110184640-110184790 | KLF4 | 23.68 |
| chr8: 95369400-95369550 | RAD54B | 48.78 |
| chr11: 17752205-17752355 | KCNC1 | 54.93 |
| chr11: 17752205-17752355 | RP11-358H18.3 | 54.93 |
| chr9: 103363560-103363710 | MSANTD3-TMEFF1 | 56.75 |
| chr5: 145945420-145945570 | TCERG1 | 57.84 |
| chr5: 145945420-145945570 | RN7SL791P | 57.84 |