SOM cluster: 2388
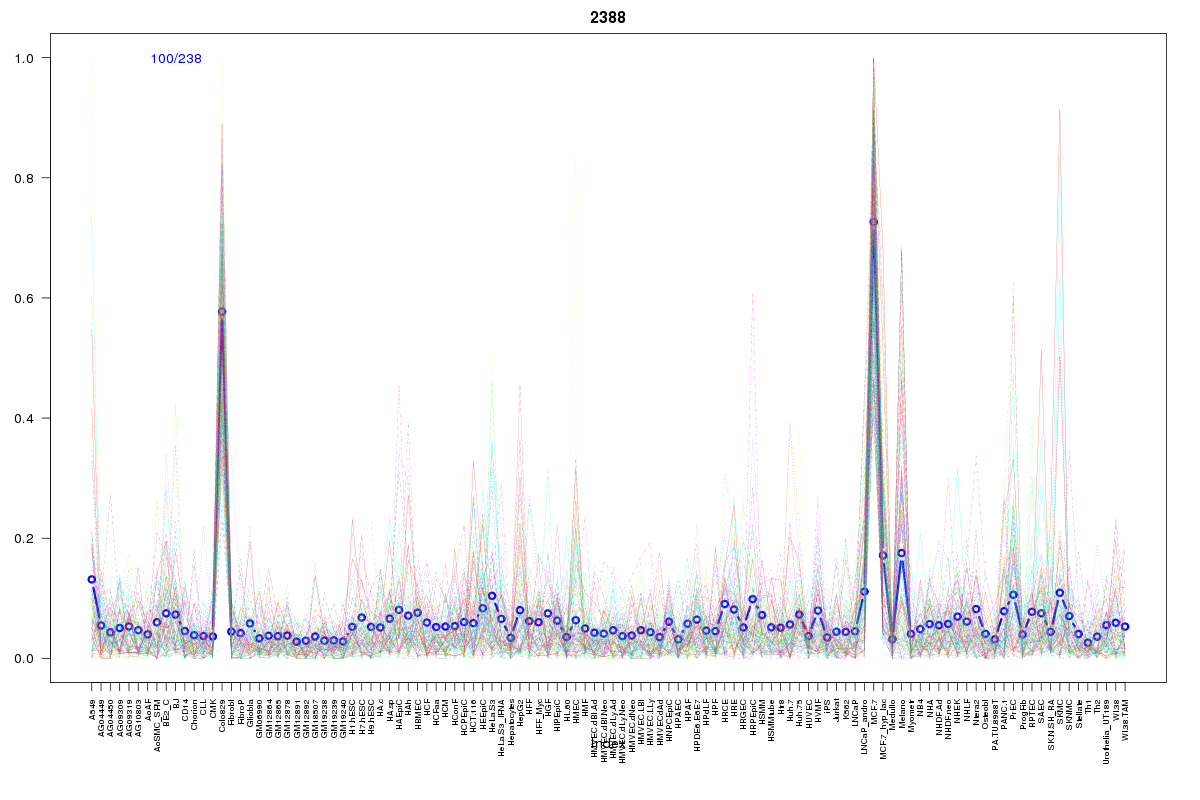
Cluster Hypersensitivity Profile

Genomic Location Trend
These plots show the distribution of the DHS sites surrounding the Transcript Start Site of the nearest gene.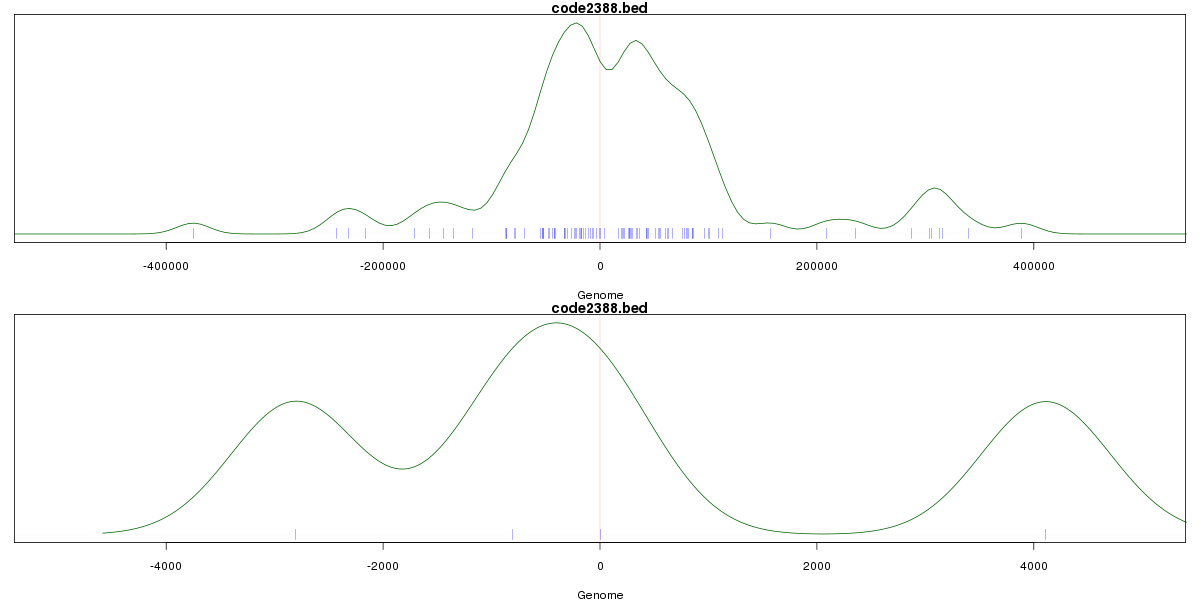
Stats
Number of sites: 238Promoter: 2%
CpG-Island: 0%
Conserved: 30%
Enriched Motifs & Matches
Match Detail: [Jaspar]
|
| ||
|---|---|---|
| Sites: 19/100 | e-val: 0.0000069 | ||
| Factor | e-val(match) | DB |
| SRY | 0.00010297 | JASPAR |
| SOX10 | 0.00013818 | JASPAR |
| Sox5 | 0.00041962 | JASPAR |
| SOX9 | 0.0015294 | JASPAR |
| Foxd3 | 0.0023368 | JASPAR |
BED file downloads
Top 10 Example Regions
| Location | Gene Link | Dist. |
|---|---|---|
| chr8: 69765920-69766070 | RP11-865I6.2 | 40.38 |
| chr3: 165570640-165570790 | BCHE | 62.85 |
| chr6: 6771840-6771990 | RP1-80N2.2 | 64.67 |
| chr3: 161131320-161131470 | SPTSSB | 69.3 |
| chr3: 161131320-161131470 | EEF1GP4 | 69.3 |
| chr17: 59389825-59389975 | TBX2 | 69.86 |
| chr17: 59389825-59389975 | BCAS3 | 69.86 |
| chr4: 89580440-89580590 | HERC3 | 72.71 |
| chr12: 79439380-79439530 | RP11-390N6.1 | 75.27 |
| chr8: 125792740-125792890 | LINC00964 | 75.38 |