SOM cluster: 2369
Cluster Hypersensitivity Profile

Genomic Location Trend
These plots show the distribution of the DHS sites surrounding the Transcript Start Site of the nearest gene.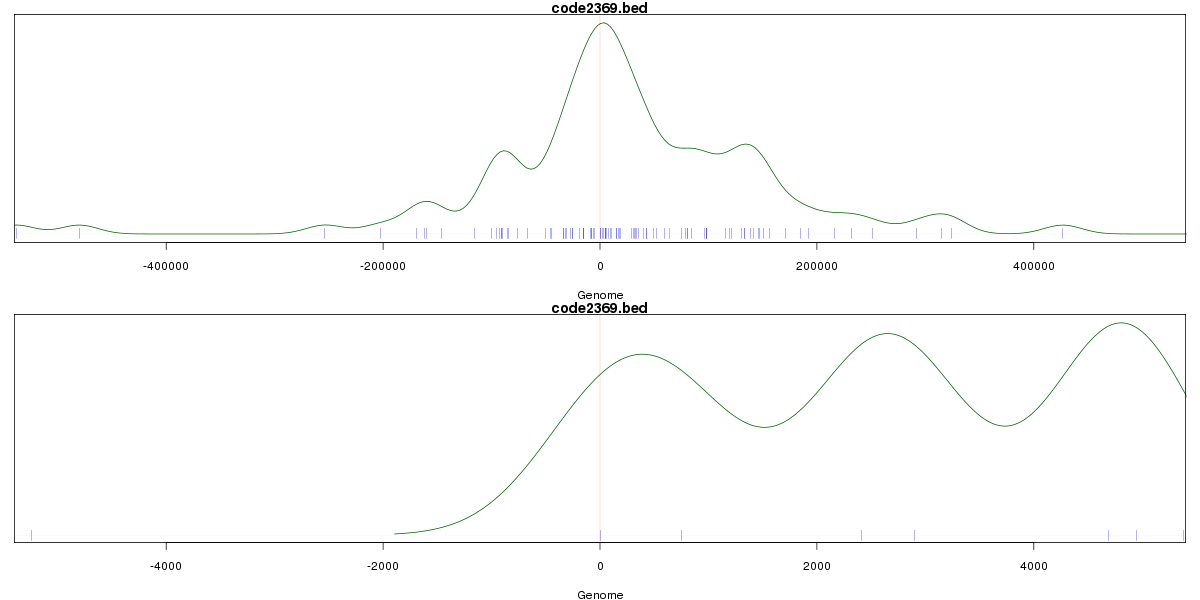
Stats
Number of sites: 198Promoter: 1%
CpG-Island: 0%
Conserved: 57%
Enriched Motifs & Matches
Match Detail: [Jaspar]
|
| ||
|---|---|---|
| Sites: 68/100 | e-val: 0 | ||
| Factor | e-val(match) | DB |
| FEV | 0.00000000000070244 | JASPAR |
| ELK4 | 0.000000034508 | JASPAR |
| SPI1 | 0.00000013597 | JASPAR |
| ELF5 | 0.00000032594 | JASPAR |
| SPIB | 0.0000012339 | JASPAR |
|
| ||
| Sites: 15/100 | e-val: 0.00015 | ||
| Factor | e-val(match) | DB |
| TLX1::NFIC | 0.000000012903 | JASPAR |
| NFATC2 | 0.0000052048 | JASPAR |
| NFIC | 0.0008787 | JASPAR |
| Pax4 | 0.0038146 | JASPAR |
| Hand1::Tcfe2a | 0.0087476 | JASPAR |
BED file downloads
Top 10 Example Regions
| Location | Gene Link | Dist. |
|---|---|---|
| chr15: 95839200-95839350 | CTD-2536I1.1 | 34.09 |
| chr3: 168950900-168951050 | MECOM | 42.48 |
| chr1: 156137460-156137610 | RAB25 | 46.2 |
| chr1: 156137460-156137610 | SEMA4A | 46.2 |
| chr5: 89814600-89814750 | LYSMD3 | 51.46 |
| chr8: 131464240-131464390 | ASAP1 | 61.11 |
| chr8: 54531180-54531330 | ATP6V1H | 61.15 |
| chr7: 35832220-35832370 | HERPUD2 | 69.43 |
| chr13: 21974040-21974190 | RNA5SP25 | 75.57 |
| chr1: 214576040-214576190 | PTPN14 | 77.67 |