SOM cluster: 2368
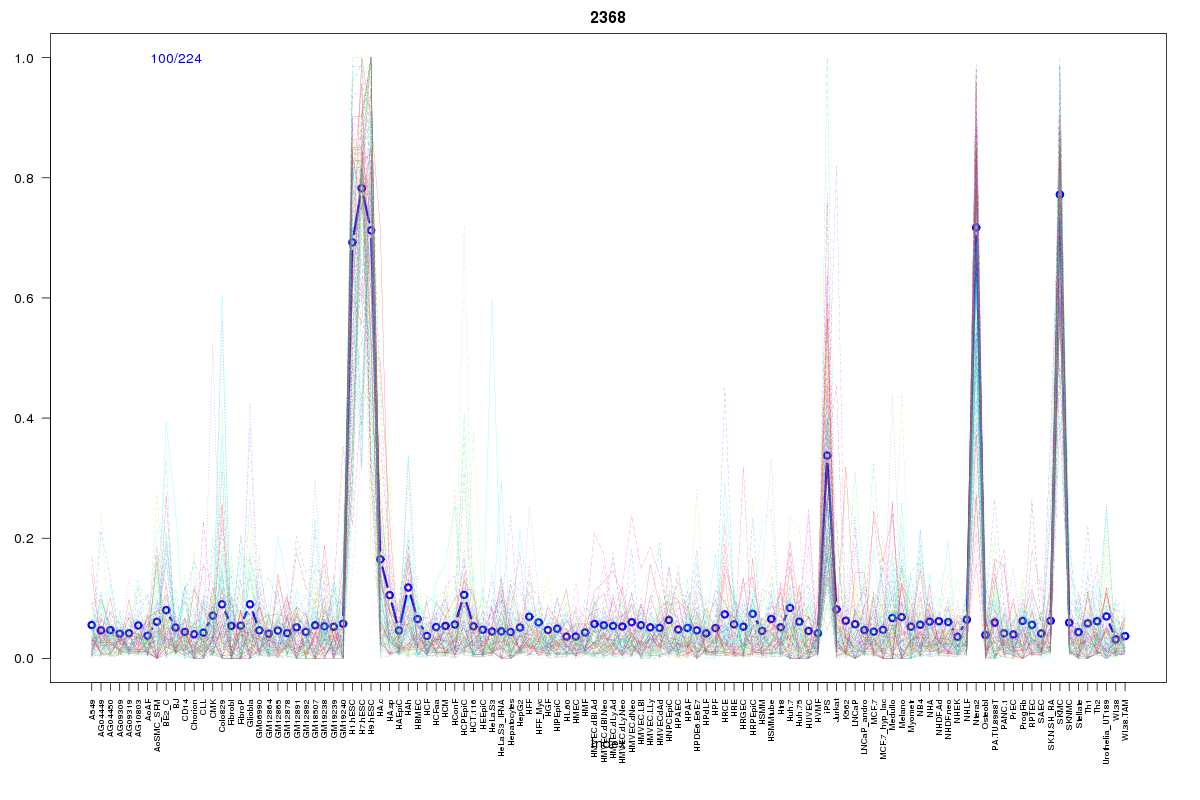
Cluster Hypersensitivity Profile

Genomic Location Trend
These plots show the distribution of the DHS sites surrounding the Transcript Start Site of the nearest gene.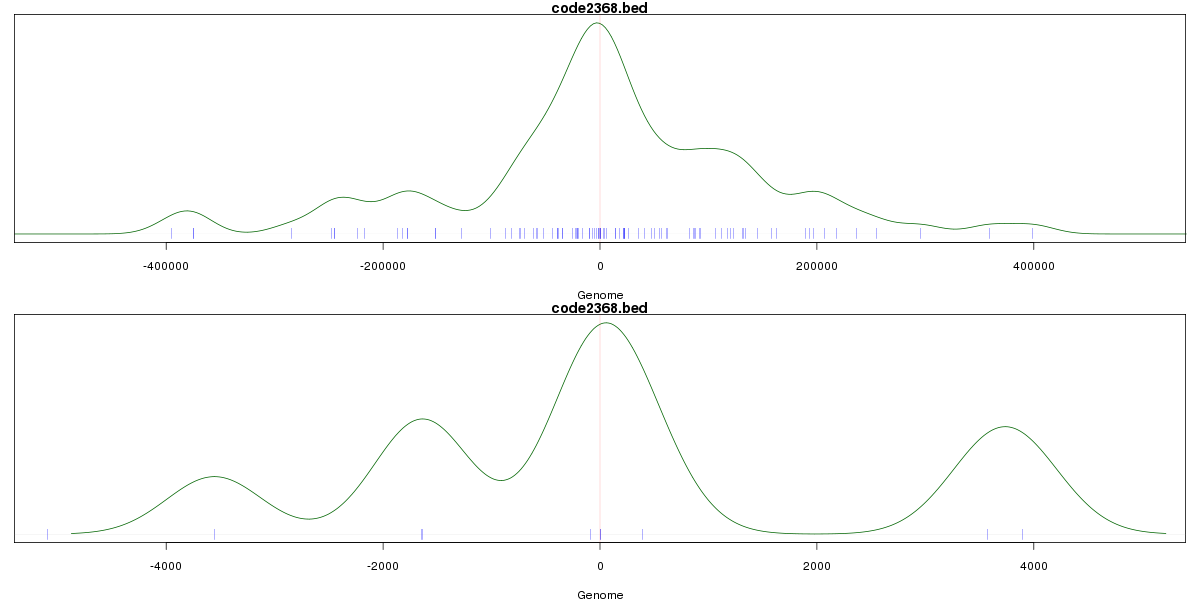
Stats
Number of sites: 224Promoter: 5%
CpG-Island: 0%
Conserved: 52%
Enriched Motifs & Matches
Match Detail: [Jaspar]
|
| ||
|---|---|---|
| Sites: 26/100 | e-val: 0.000000000000078 | ||
| Factor | e-val(match) | DB |
| SP1 | 0.000000014974 | JASPAR |
| Pax4 | 0.000000061603 | JASPAR |
| RREB1 | 0.00000015617 | JASPAR |
| EWSR1-FLI1 | 0.0000011243 | JASPAR |
| Klf4 | 0.00064774 | JASPAR |
|
| ||
| Sites: 24/100 | e-val: 0.00001 | ||
| Factor | e-val(match) | DB |
| SPI1 | 0.0000069312 | JASPAR |
| FEV | 0.000013859 | JASPAR |
| CTCF | 0.00096875 | JASPAR |
| Stat3 | 0.0024875 | JASPAR |
| ELK4 | 0.0025923 | JASPAR |
BED file downloads
Top 10 Example Regions
| Location | Gene Link | Dist. |
|---|---|---|
| chr8: 75021020-75021170 | RP11-6I2.3 | 43.55 |
| chr3: 54855320-54855470 | CACNA2D3-AS1 | 46.25 |
| chr13: 100624140-100624290 | ZIC5 | 47.88 |
| chr13: 100624140-100624290 | ZIC2 | 47.88 |
| chrX: 68327360-68327510 | PJA1 | 50.11 |
| chr12: 41213380-41213530 | CNTN1 | 50.47 |
| chr12: 91763960-91764110 | RP11-121E16.1 | 56.61 |
| chr2: 164555480-164555630 | FIGN | 57.3 |
| chr5: 36066980-36067130 | UGT3A2 | 63.71 |
| chr1: 237195440-237195590 | RYR2 | 64.4 |