SOM cluster: 2367
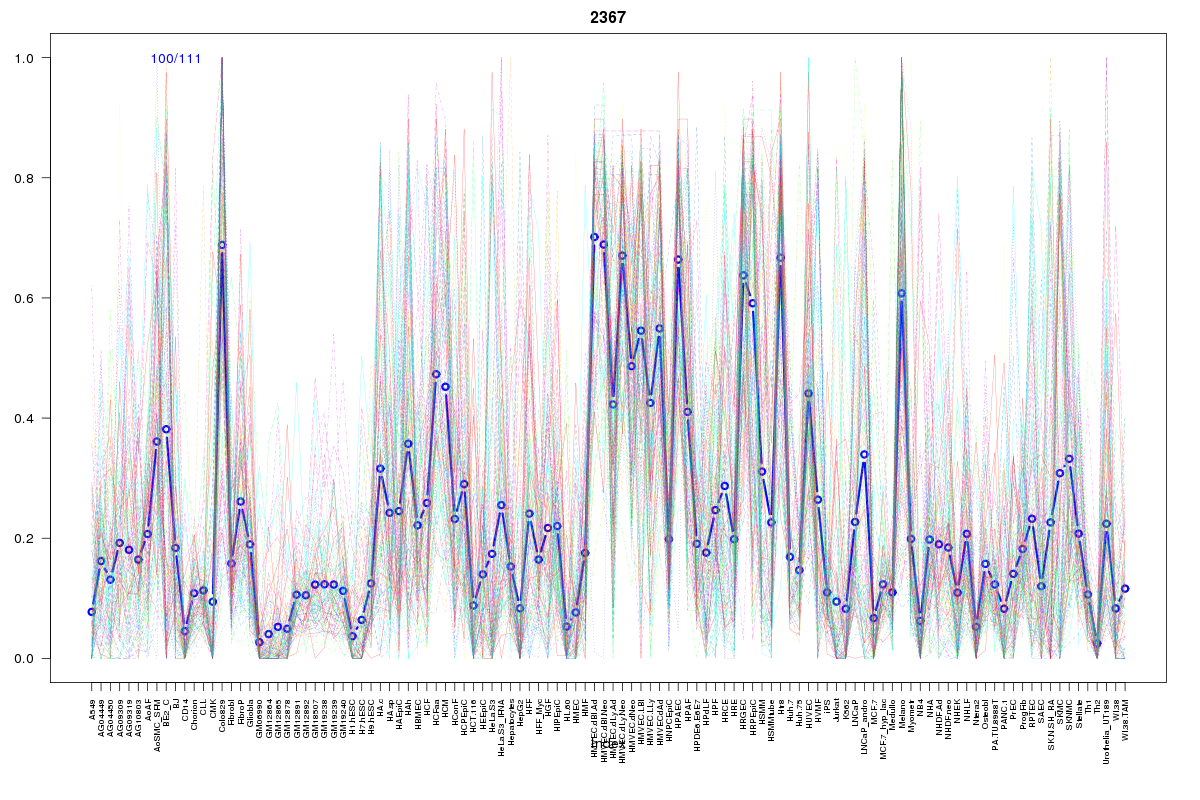
Cluster Hypersensitivity Profile

Genomic Location Trend
These plots show the distribution of the DHS sites surrounding the Transcript Start Site of the nearest gene.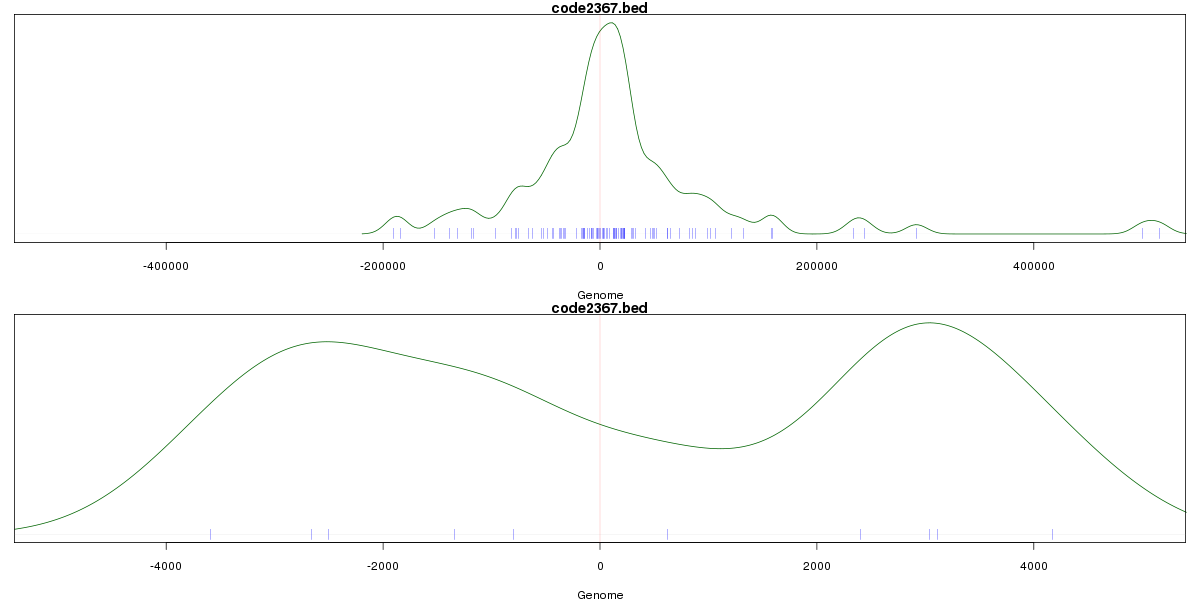
Stats
Number of sites: 111Promoter: 2%
CpG-Island: 0%
Conserved: 73%
Enriched Motifs & Matches
Match Detail: [Jaspar]
|
| ||
|---|---|---|
| Sites: 55/100 | e-val: 3.00004e-41 | ||
| Factor | e-val(match) | DB |
| TLX1::NFIC | 0.00000000017665 | JASPAR |
| NFIC | 0.0023022 | JASPAR |
| NFATC2 | 0.0037425 | JASPAR |
| Hand1::Tcfe2a | 0.036402 | JASPAR |
| HNF4A | 0.03723 | JASPAR |
BED file downloads
Top 10 Example Regions
| Location | Gene Link | Dist. |
|---|---|---|
| chrX: 15328360-15328510 | PIR | 47.57 |
| chrX: 15328360-15328510 | ASB9 | 47.57 |
| chr3: 151488860-151489010 | AADACL2 | 51.47 |
| chr3: 151488860-151489010 | RP11-64D22.2 | 51.47 |
| chr11: 33497580-33497730 | KIAA1549L | 53.61 |
| chr11: 33497580-33497730 | RP1-305G21.1 | 53.61 |
| chr9: 35771640-35771790 | MSMP | 60.14 |
| chr18: 55447640-55447790 | RSL24D1P11 | 61.34 |
| chr2: 224824520-224824670 | WDFY1 | 63.36 |
| chr6: 113301120-113301270 | RNU6-1163P | 71.74 |