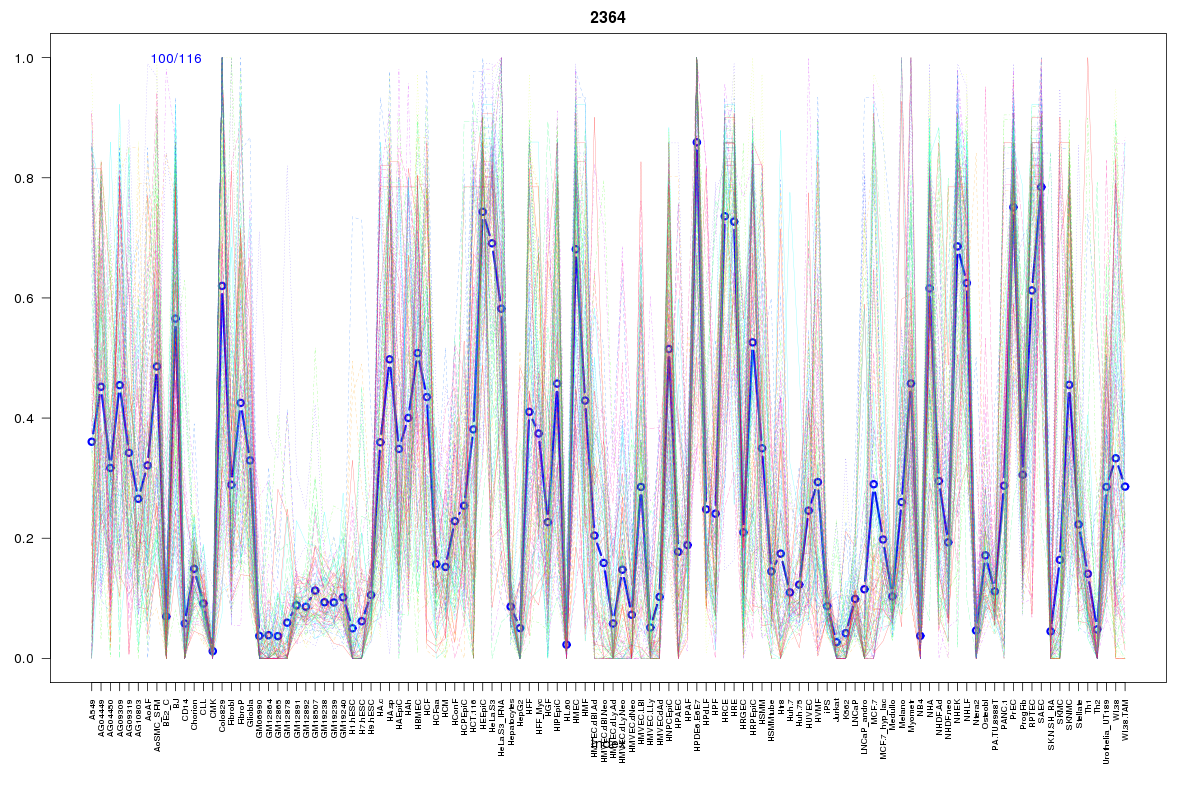
SOM cluster: 2364
Cluster Hypersensitivity Profile

Genomic Location Trend
These plots show the distribution of the DHS sites surrounding the Transcript Start Site of the nearest gene.
Stats
Number of sites: 116Promoter: 0%
CpG-Island: 0%
Conserved: 46%
Enriched Motifs & Matches
Match Detail: [Jaspar]
|
| ||
|---|---|---|
| Sites: 58/100 | e-val: 2e-27 | ||
| Factor | e-val(match) | DB |
| AP1 | 0.000000000039422 | JASPAR |
| NFE2L2 | 0.0000000048647 | JASPAR |
| PPARG | 0.0040698 | JASPAR |
| NFE2L1::MafG | 0.004725 | JASPAR |
| Foxa2 | 0.010239 | JASPAR |
BED file downloads
Top 10 Example Regions
| Location | Gene Link | Dist. |
|---|---|---|
| chr1: 182998900-182999050 | LAMC1 | 43.07 |
| chr1: 169968600-169968750 | KIFAP3 | 48.97 |
| chr12: 76054060-76054210 | RP11-114H23.1 | 52.89 |
| chr9: 113739800-113739950 | LPAR1 | 57.79 |
| chr1: 184922800-184922950 | FAM129A | 58.67 |
| chr6: 31025920-31026070 | PSORS1C1 | 68.31 |
| chr6: 31025920-31026070 | HCG22 | 68.31 |
| chr3: 150936980-150937130 | GPR171 | 72.48 |
| chr3: 150936980-150937130 | GPR87 | 72.48 |
| chr4: 157855260-157855410 | PDGFC | 77.01 |