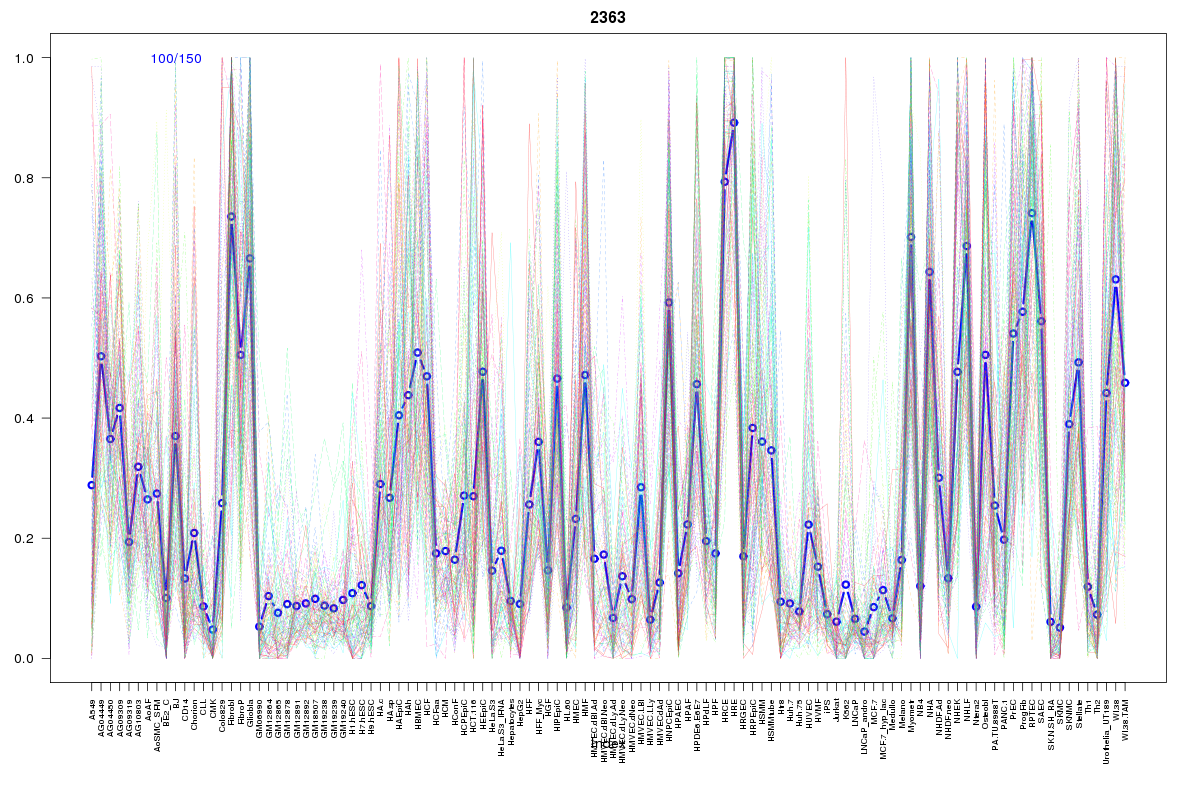
SOM cluster: 2363
Cluster Hypersensitivity Profile

Genomic Location Trend
These plots show the distribution of the DHS sites surrounding the Transcript Start Site of the nearest gene.
Stats
Number of sites: 150Promoter: 5%
CpG-Island: 0%
Conserved: 32%
Enriched Motifs & Matches
Match Detail: [Jaspar]
|
| ||
|---|---|---|
| Sites: 55/100 | e-val: 1.5e-32 | ||
| Factor | e-val(match) | DB |
| AP1 | 0.00000000013019 | JASPAR |
| NFE2L2 | 0.00000000023367 | JASPAR |
| Foxa2 | 0.0017717 | JASPAR |
| PPARG | 0.0046744 | JASPAR |
| NFE2L1::MafG | 0.0083251 | JASPAR |
BED file downloads
Top 10 Example Regions
| Location | Gene Link | Dist. |
|---|---|---|
| chr17: 70598780-70598930 | LINC00511 | 41.97 |
| chr8: 123972100-123972250 | RP11-557C18.3 | 43.18 |
| chr1: 95239520-95239670 | SLC44A3 | 43.7 |
| chr1: 95239520-95239670 | LINC01057 | 43.7 |
| chr2: 160748700-160748850 | PLA2R1 | 48.39 |
| chr2: 160748700-160748850 | LY75-CD302 | 48.39 |
| chr2: 160748700-160748850 | LY75 | 48.39 |
| chr17: 61594500-61594650 | TANC2 | 55.45 |
| chr13: 30498800-30498950 | UBL3 | 56.69 |
| chr4: 6993780-6993930 | RN7SKP292 | 57.78 |