SOM cluster: 2357
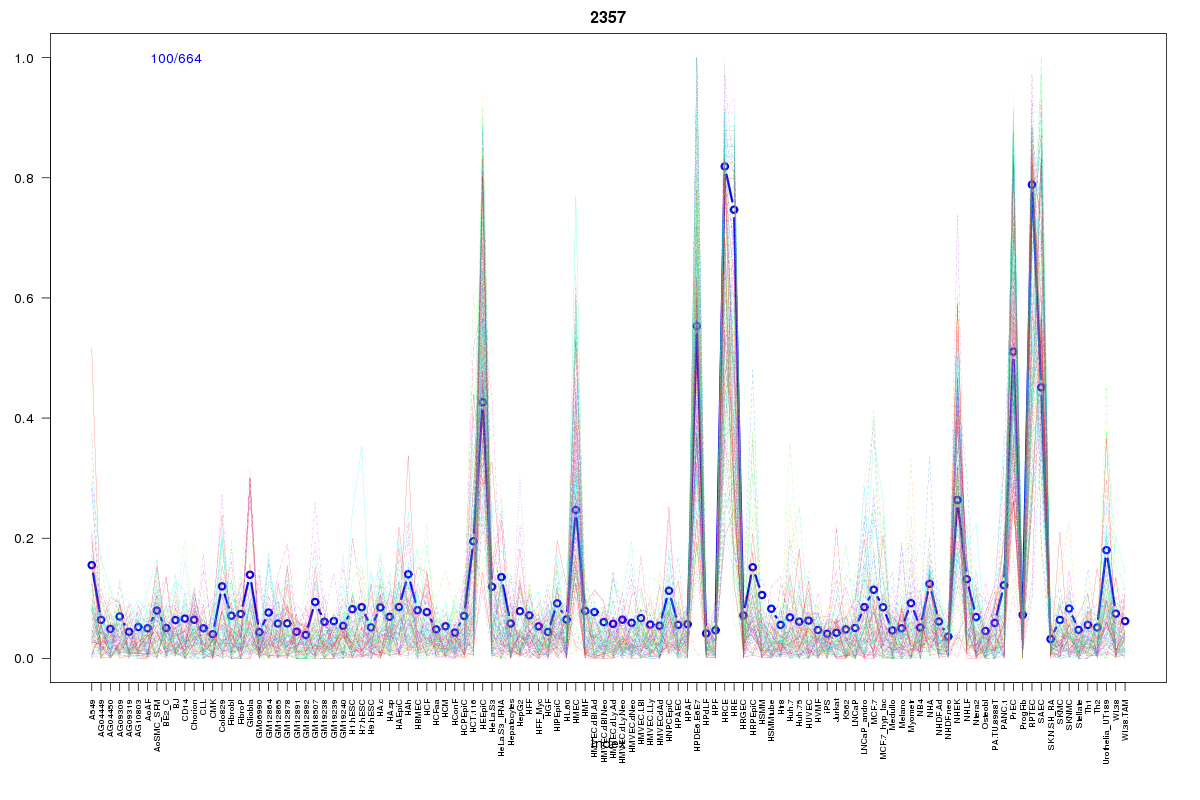
Cluster Hypersensitivity Profile

Genomic Location Trend
These plots show the distribution of the DHS sites surrounding the Transcript Start Site of the nearest gene.
Stats
Number of sites: 664Promoter: 2%
CpG-Island: 0%
Conserved: 24%
Enriched Motifs & Matches
Match Detail: [Jaspar]
|
| ||
|---|---|---|
| Sites: 51/100 | e-val: 0.000000000083 | ||
| Factor | e-val(match) | DB |
| AP1 | 0.000000000015706 | JASPAR |
| NFE2L2 | 0.00000005329 | JASPAR |
| Foxa2 | 0.0033706 | JASPAR |
| FOXA1 | 0.0065207 | JASPAR |
| PPARG | 0.0090029 | JASPAR |
BED file downloads
Top 10 Example Regions
| Location | Gene Link | Dist. |
|---|---|---|
| chr11: 34502940-34503090 | RP1-53C18.3 | 34.88 |
| chr11: 33138240-33138390 | TCP11L1 | 43.11 |
| chr11: 33138240-33138390 | DEPDC7 | 43.11 |
| chr8: 140191540-140191690 | RP11-324F11.1 | 45.8 |
| chr2: 55783220-55783370 | CCDC104 | 45.97 |
| chr11: 13244020-13244170 | ARNTL | 48.93 |
| chr7: 117085420-117085570 | CFTR | 51.62 |
| chr4: 141264520-141264670 | SCOC | 52.06 |
| chr12: 107779325-107779475 | BTBD11 | 52.38 |
| chr6: 35678100-35678250 | RP3-510O8.4 | 52.71 |