SOM cluster: 2350
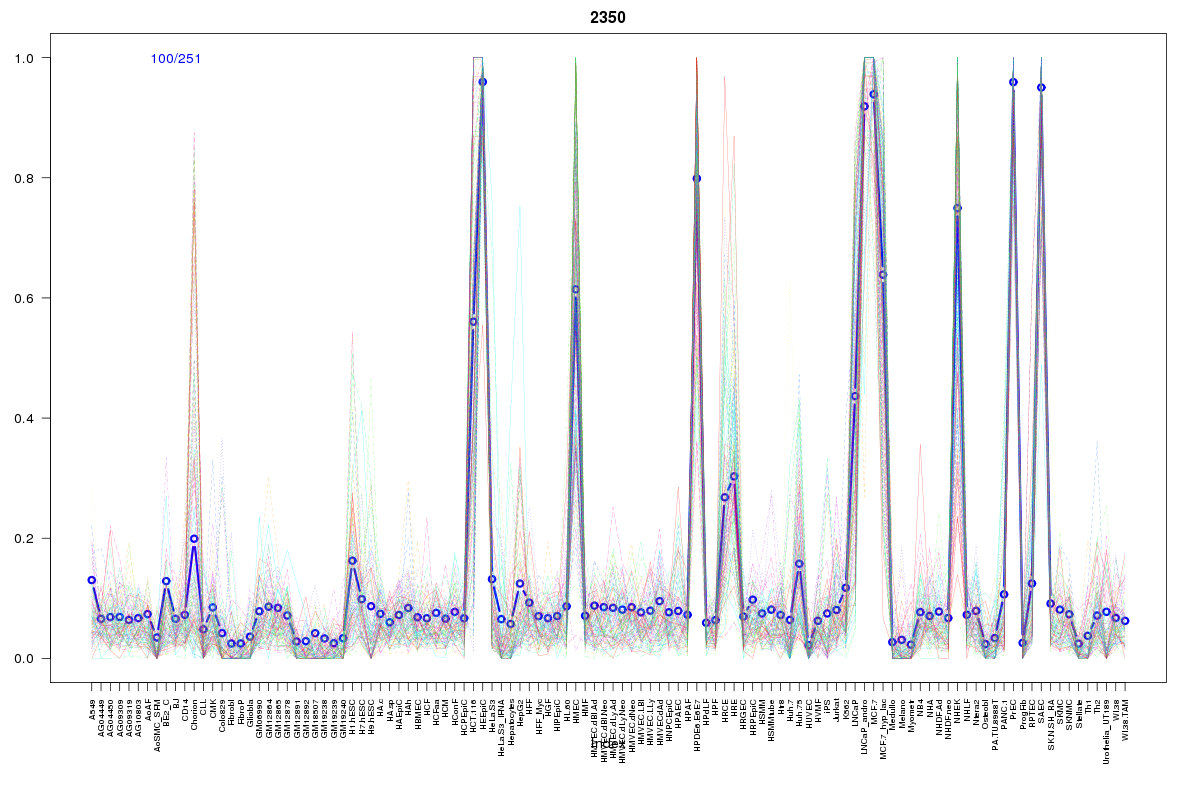
Cluster Hypersensitivity Profile

Genomic Location Trend
These plots show the distribution of the DHS sites surrounding the Transcript Start Site of the nearest gene.
Stats
Number of sites: 251Promoter: 3%
CpG-Island: 1%
Conserved: 49%
Enriched Motifs & Matches
Match Detail: [Jaspar]
|
| ||
|---|---|---|
| Sites: 57/100 | e-val: 0 | ||
| Factor | e-val(match) | DB |
| NFATC2 | 0.00086701 | JASPAR |
| RXRA::VDR | 0.001261 | JASPAR |
| ELK4 | 0.013817 | JASPAR |
| Tcfcp2l1 | 0.026095 | JASPAR |
| FOXO3 | 0.033198 | JASPAR |
|
| ||
| Sites: 14/100 | e-val: 0.55 | ||
| Factor | e-val(match) | DB |
| TLX1::NFIC | 0.0072021 | JASPAR |
| FEV | 0.0075777 | JASPAR |
| SPI1 | 0.01288 | JASPAR |
| Stat3 | 0.013008 | JASPAR |
| TP53 | 0.0183 | JASPAR |
BED file downloads
Top 10 Example Regions
| Location | Gene Link | Dist. |
|---|---|---|
| chr11: 9384980-9385130 | DENND5A | 42.1 |
| chr1: 156123240-156123390 | SEMA4A | 44.41 |
| chr1: 156123240-156123390 | BGLAP | 44.41 |
| chr1: 156123240-156123390 | RAB25 | 44.41 |
| chr3: 182457040-182457190 | RP11-646E18.3 | 48.44 |
| chr17: 37862100-37862250 | ERBB2 | 57.97 |
| chr17: 37862100-37862250 | GRB7 | 57.97 |
| chr11: 117800120-117800270 | TMPRSS13 | 61.26 |
| chr19: 2953280-2953430 | ZNF57 | 63.53 |
| chr3: 42518360-42518510 | VIPR1 | 65.16 |