SOM cluster: 2348
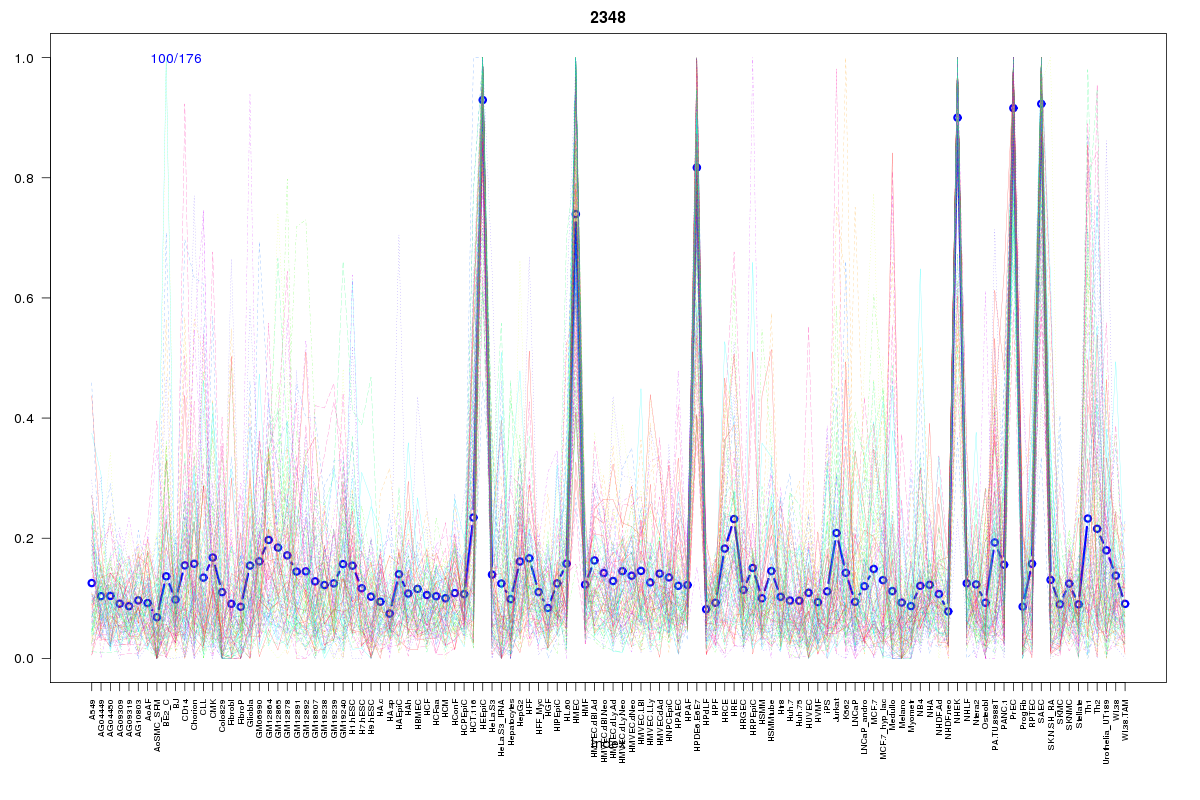
Cluster Hypersensitivity Profile

Genomic Location Trend
These plots show the distribution of the DHS sites surrounding the Transcript Start Site of the nearest gene.
Stats
Number of sites: 176Promoter: 11%
CpG-Island: 2%
Conserved: 51%
Enriched Motifs & Matches
Match Detail: [Jaspar]
|
| ||
|---|---|---|
| Sites: 44/100 | e-val: 1.4e-23 | ||
| Factor | e-val(match) | DB |
| TP53 | 0 | JASPAR |
| Tcfcp2l1 | 0.000063025 | JASPAR |
| NF-kappaB | 0.0022104 | JASPAR |
| REL | 0.002669 | JASPAR |
| Stat3 | 0.0047557 | JASPAR |
|
| ||
| Sites: 20/100 | e-val: 0.0000002 | ||
| Factor | e-val(match) | DB |
| Pax4 | 0.00000020188 | JASPAR |
| SP1 | 0.00000026885 | JASPAR |
| RREB1 | 0.000015157 | JASPAR |
| EWSR1-FLI1 | 0.0017614 | JASPAR |
| Klf4 | 0.0038805 | JASPAR |
|
| ||
| Sites: 19/100 | e-val: 2.8 | ||
| Factor | e-val(match) | DB |
| EWSR1-FLI1 | 0.000028232 | JASPAR |
| SP1 | 0.000056605 | JASPAR |
| SPIB | 0.00036117 | JASPAR |
| SPI1 | 0.0033639 | JASPAR |
| MZF1_1-4 | 0.01653 | JASPAR |
BED file downloads
Top 10 Example Regions
| Location | Gene Link | Dist. |
|---|---|---|
| chr17: 73685585-73685735 | SAP30BP | 48.17 |
| chr17: 73685585-73685735 | RECQL5 | 48.17 |
| chr17: 73685585-73685735 | ITGB4 | 48.17 |
| chr18: 21451440-21451590 | LAMA3 | 52.78 |
| chr8: 134315325-134315475 | NDRG1 | 58.98 |
| chr1: 204413100-204413250 | RP11-430C7.2 | 61.83 |
| chr3: 47022105-47022255 | NBEAL2 | 62.61 |
| chr2: 74649440-74649590 | INO80B | 62.73 |
| chr2: 74649440-74649590 | DQX1 | 62.73 |
| chr2: 74649440-74649590 | WDR54 | 62.73 |