SOM cluster: 2340
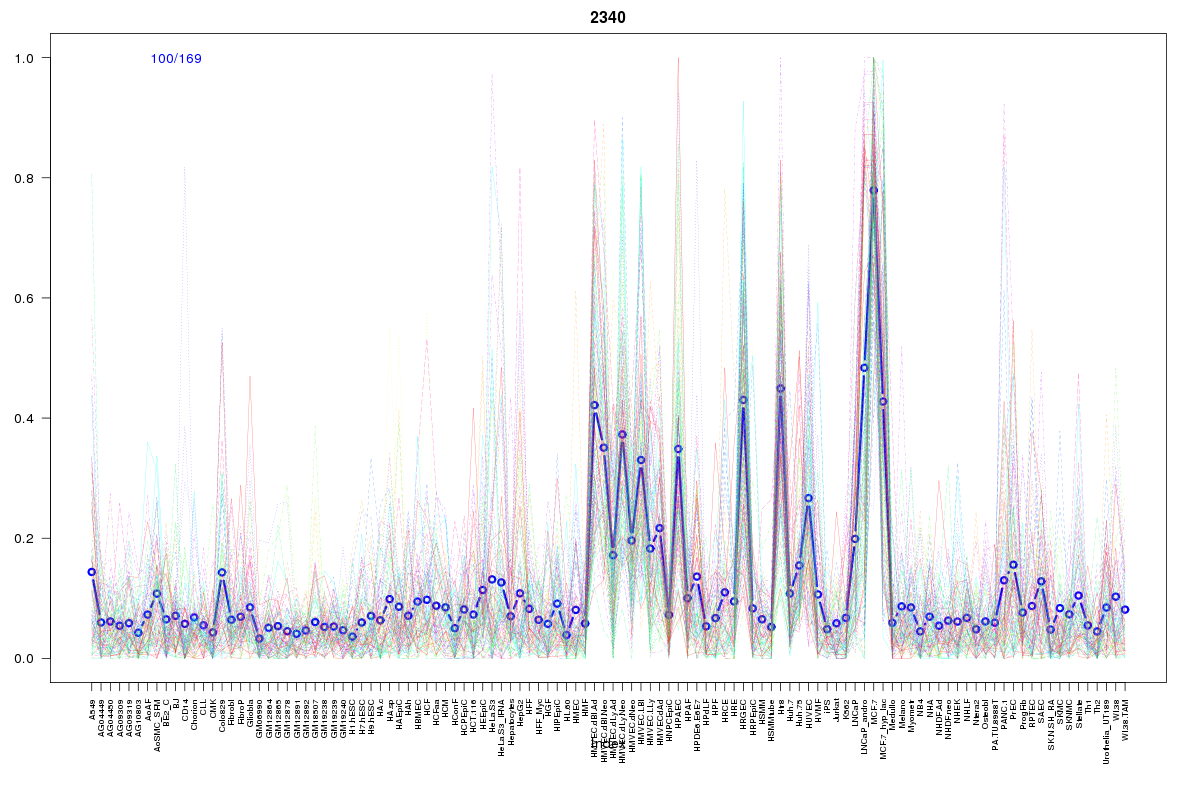
Cluster Hypersensitivity Profile

Genomic Location Trend
These plots show the distribution of the DHS sites surrounding the Transcript Start Site of the nearest gene.
Stats
Number of sites: 169Promoter: 3%
CpG-Island: 0%
Conserved: 58%
Enriched Motifs & Matches
Match Detail: [Jaspar]
|
| ||
|---|---|---|
| Sites: 47/100 | e-val: 0.0000000000000064 | ||
| Factor | e-val(match) | DB |
| FOXA1 | 0.0000000049698 | JASPAR |
| Foxd3 | 0.00000011793 | JASPAR |
| FOXI1 | 0.00000080553 | JASPAR |
| Foxa2 | 0.0000039669 | JASPAR |
| FOXF2 | 0.00022661 | JASPAR |
BED file downloads
Top 10 Example Regions
| Location | Gene Link | Dist. |
|---|---|---|
| chr17: 59130960-59131110 | BCAS3 | 37.02 |
| chr17: 58346900-58347050 | USP32 | 45.06 |
| chr3: 14918465-14918615 | FGD5-AS1 | 61.21 |
| chr8: 42329025-42329175 | SLC20A2 | 61.55 |
| chr20: 52279300-52279450 | AC005808.3 | 63.89 |
| chr7: 37359900-37360050 | SNORA51 | 68.95 |
| chr20: 52482080-52482230 | BCAS1 | 69.1 |
| chr17: 16053920-16054070 | NCOR1 | 81.82 |
| chr17: 59429660-59429810 | C17orf82 | 82.06 |
| chr20: 46477420-46477570 | SULF2 | 82.58 |